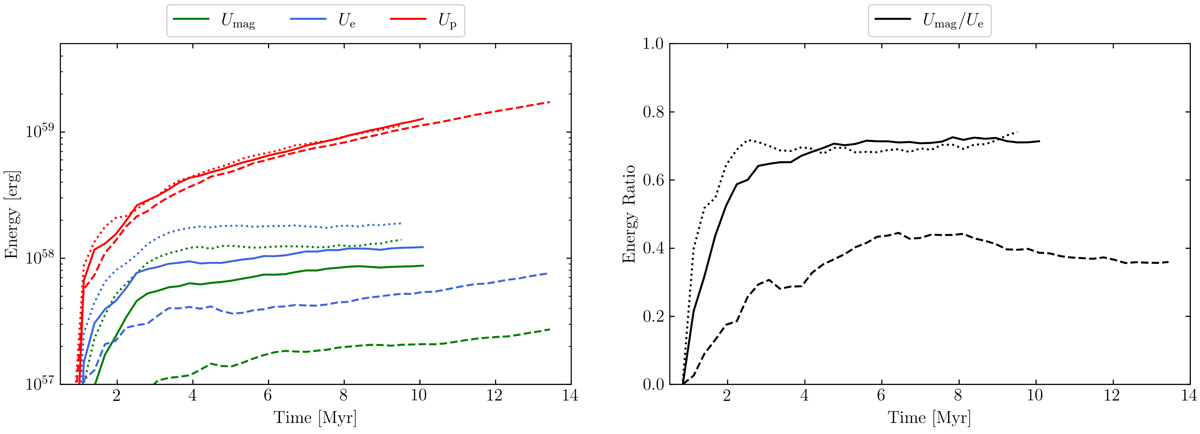
Fig. 9.
Download original image
Energies in the cocoon as a function of time for all models. Left: Time evolution of different energy components of the cocoon for model A (dotted lines), B (solid lines), and C (dashed lines), respectively. We define the cocoon as grids with an electron temperature higher than 108 K. Right: Time evolution of the ratio between the magnetic field and the electron energy for model A (dotted lines), B (solid lines), and C (dashed lines).
Current usage metrics show cumulative count of Article Views (full-text article views including HTML views, PDF and ePub downloads, according to the available data) and Abstracts Views on Vision4Press platform.
Data correspond to usage on the plateform after 2015. The current usage metrics is available 48-96 hours after online publication and is updated daily on week days.
Initial download of the metrics may take a while.