Open Access
Fig. C.2.
Download original image
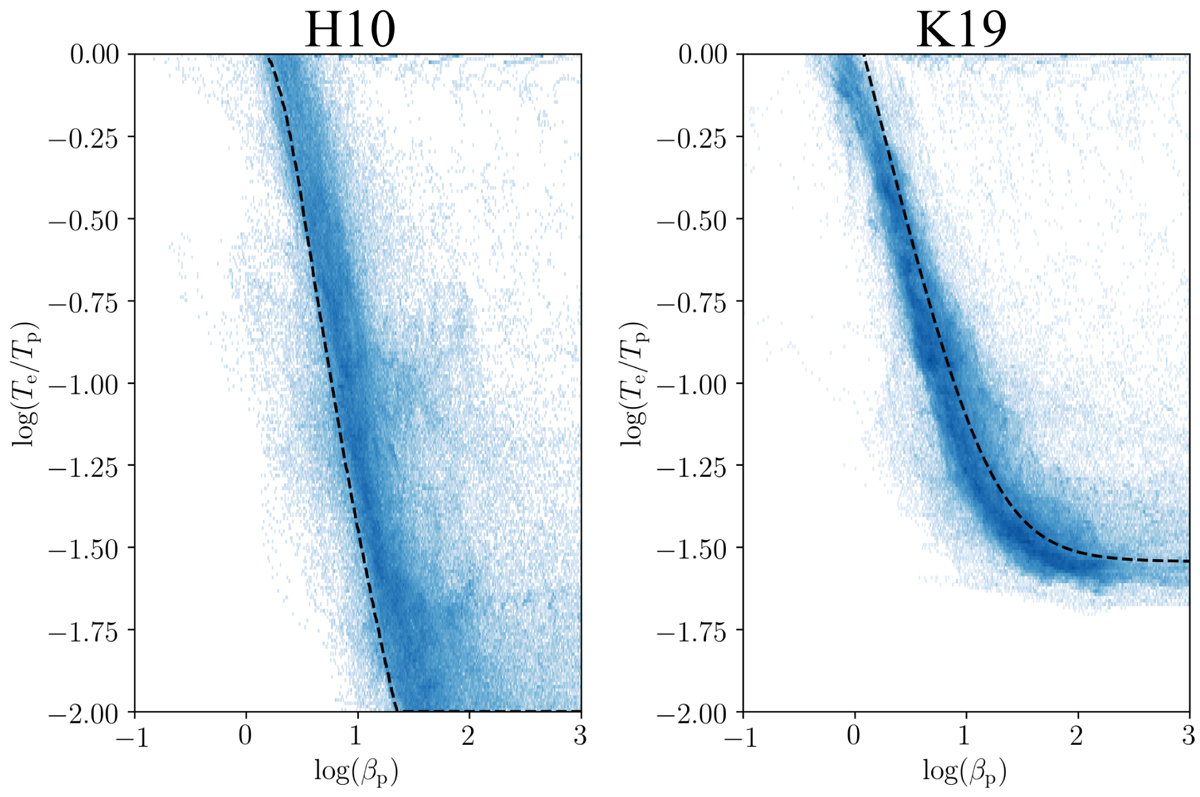
Te/Tp − βp histogram for regions in the cocoon using H10 (left) and K19 (right) at t = 16.86 Myr, respectively. The dashed line depicts the electron to proton temperature ratio corresponding to the equilibrium state for plasma βp, as implied by the turbulence heating in Eq. 24 for H10 and K19.
Current usage metrics show cumulative count of Article Views (full-text article views including HTML views, PDF and ePub downloads, according to the available data) and Abstracts Views on Vision4Press platform.
Data correspond to usage on the plateform after 2015. The current usage metrics is available 48-96 hours after online publication and is updated daily on week days.
Initial download of the metrics may take a while.