Fig. 11.
Download original image
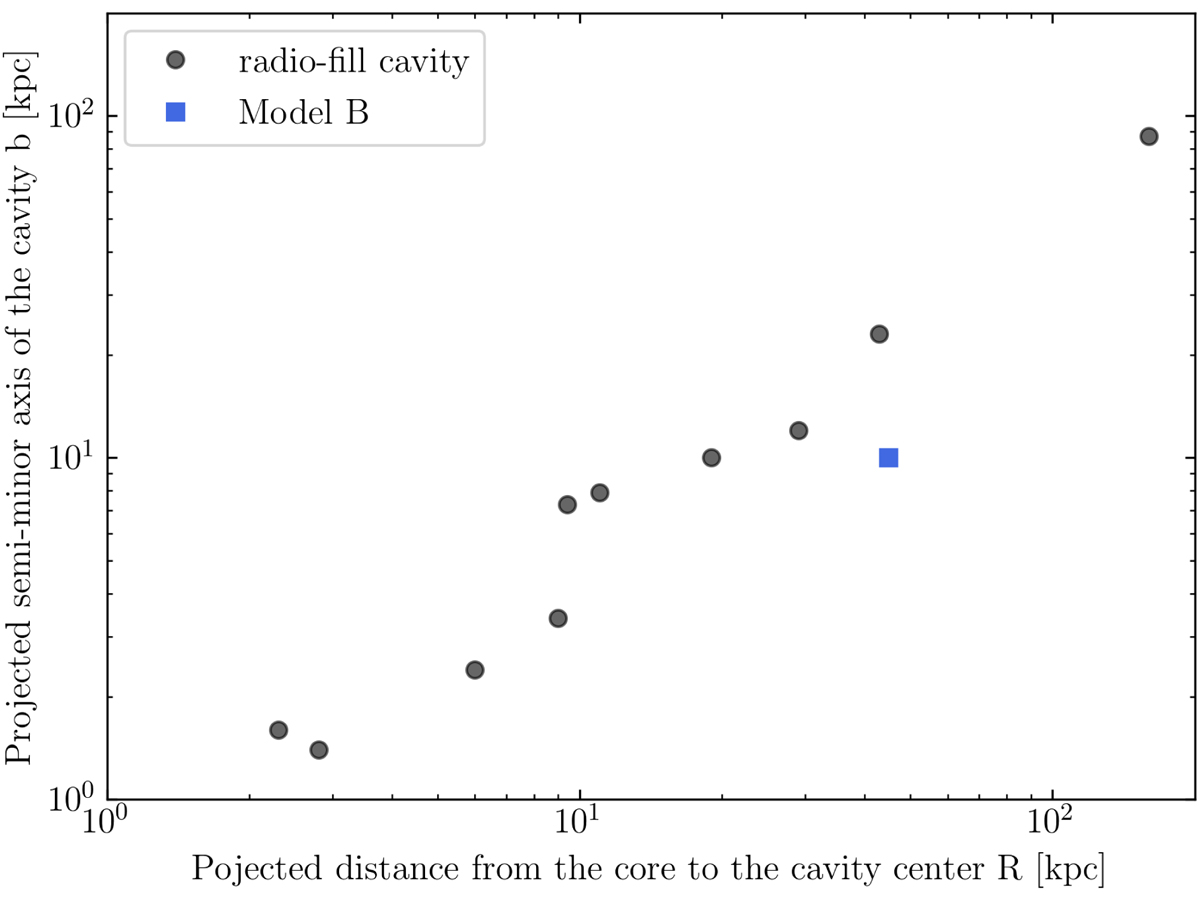
Projected distance from core to cavity center, R, versus Projected semi-minor axis of the cavity, b. Black circles show the radio-filled cavities taken from Rafferty et al. (2006). Blue square shows our result for model B at t = 9.94 Myr. Because R and b values for models A and C have similar values to model B, we do not show them.
Current usage metrics show cumulative count of Article Views (full-text article views including HTML views, PDF and ePub downloads, according to the available data) and Abstracts Views on Vision4Press platform.
Data correspond to usage on the plateform after 2015. The current usage metrics is available 48-96 hours after online publication and is updated daily on week days.
Initial download of the metrics may take a while.