Open Access
Fig. 2
Download original image
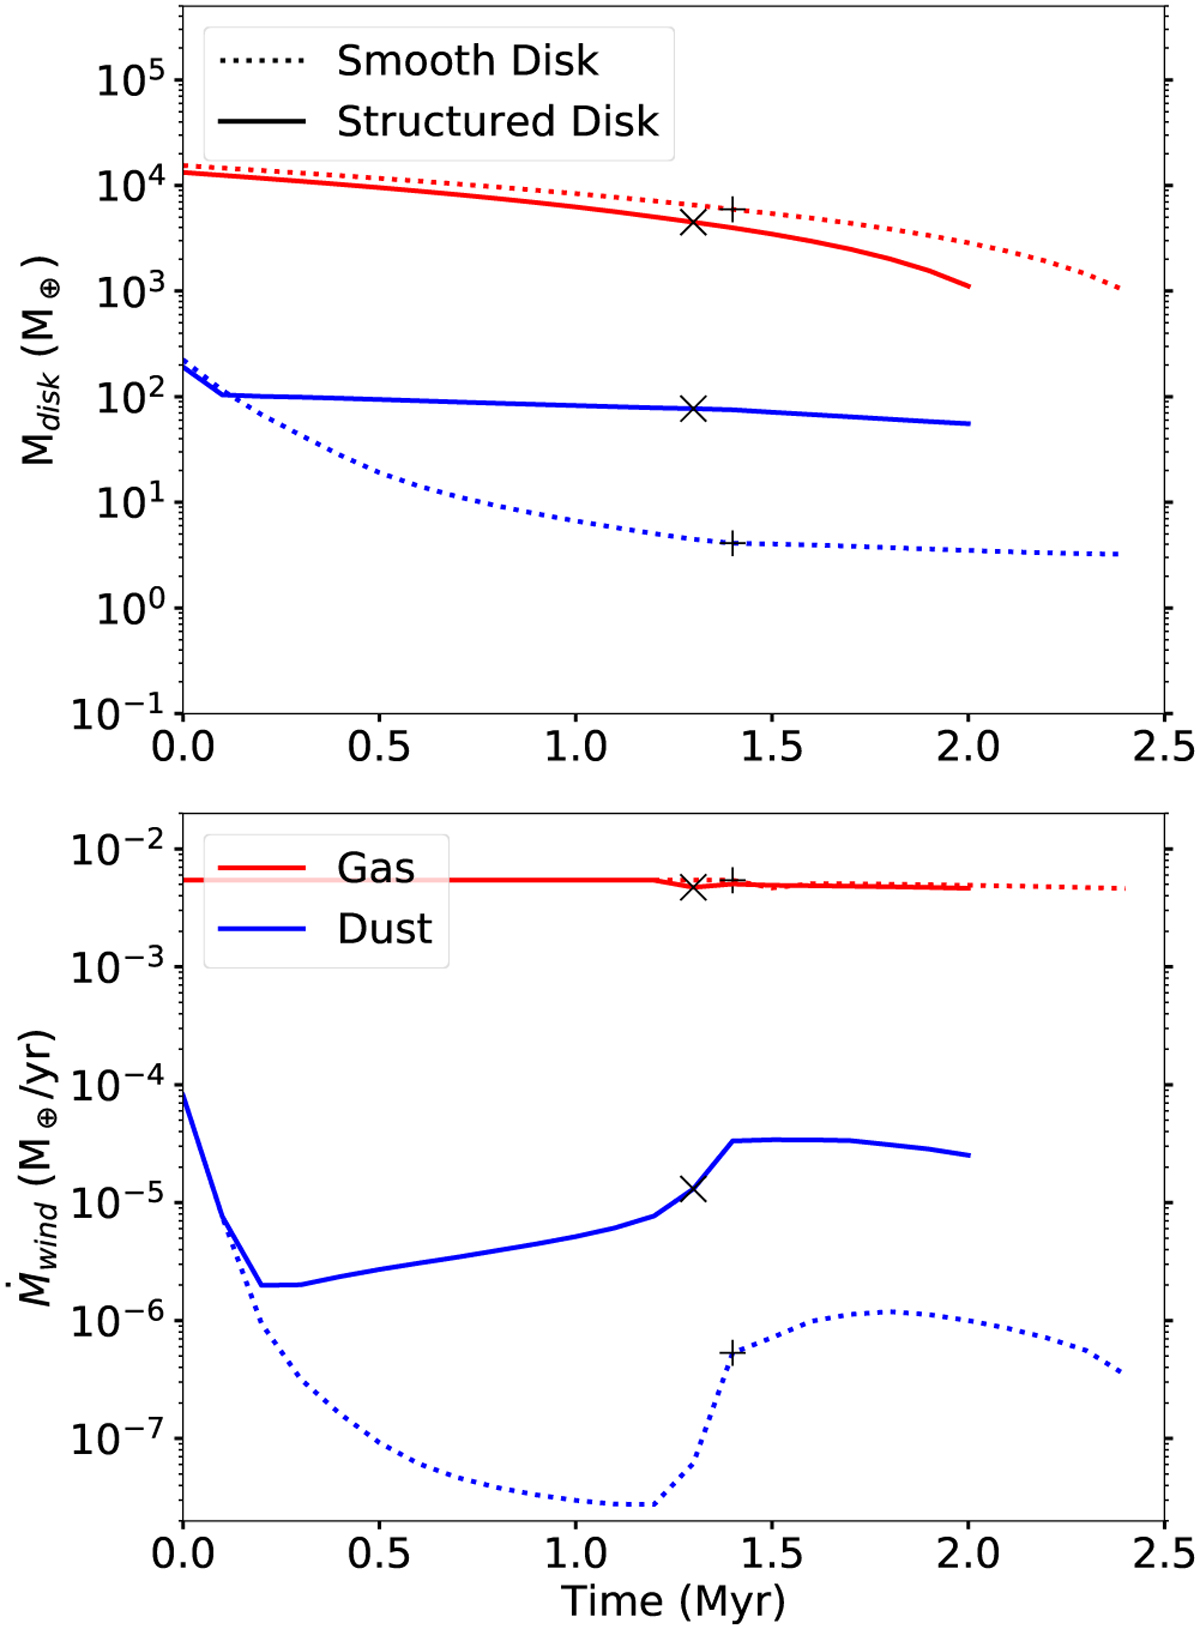
Top: Mass evolution of the disk mass in gas (red lines) and dust (blue lines). Bottom: Evolution of the mass loss rate of gas and dust by photoevaporative winds. The markers indicate the moment when photo-evaporation opens a cavity in the inner disk (“+” for the initially smooth disk, “x” for the initially structured disk).
Current usage metrics show cumulative count of Article Views (full-text article views including HTML views, PDF and ePub downloads, according to the available data) and Abstracts Views on Vision4Press platform.
Data correspond to usage on the plateform after 2015. The current usage metrics is available 48-96 hours after online publication and is updated daily on week days.
Initial download of the metrics may take a while.