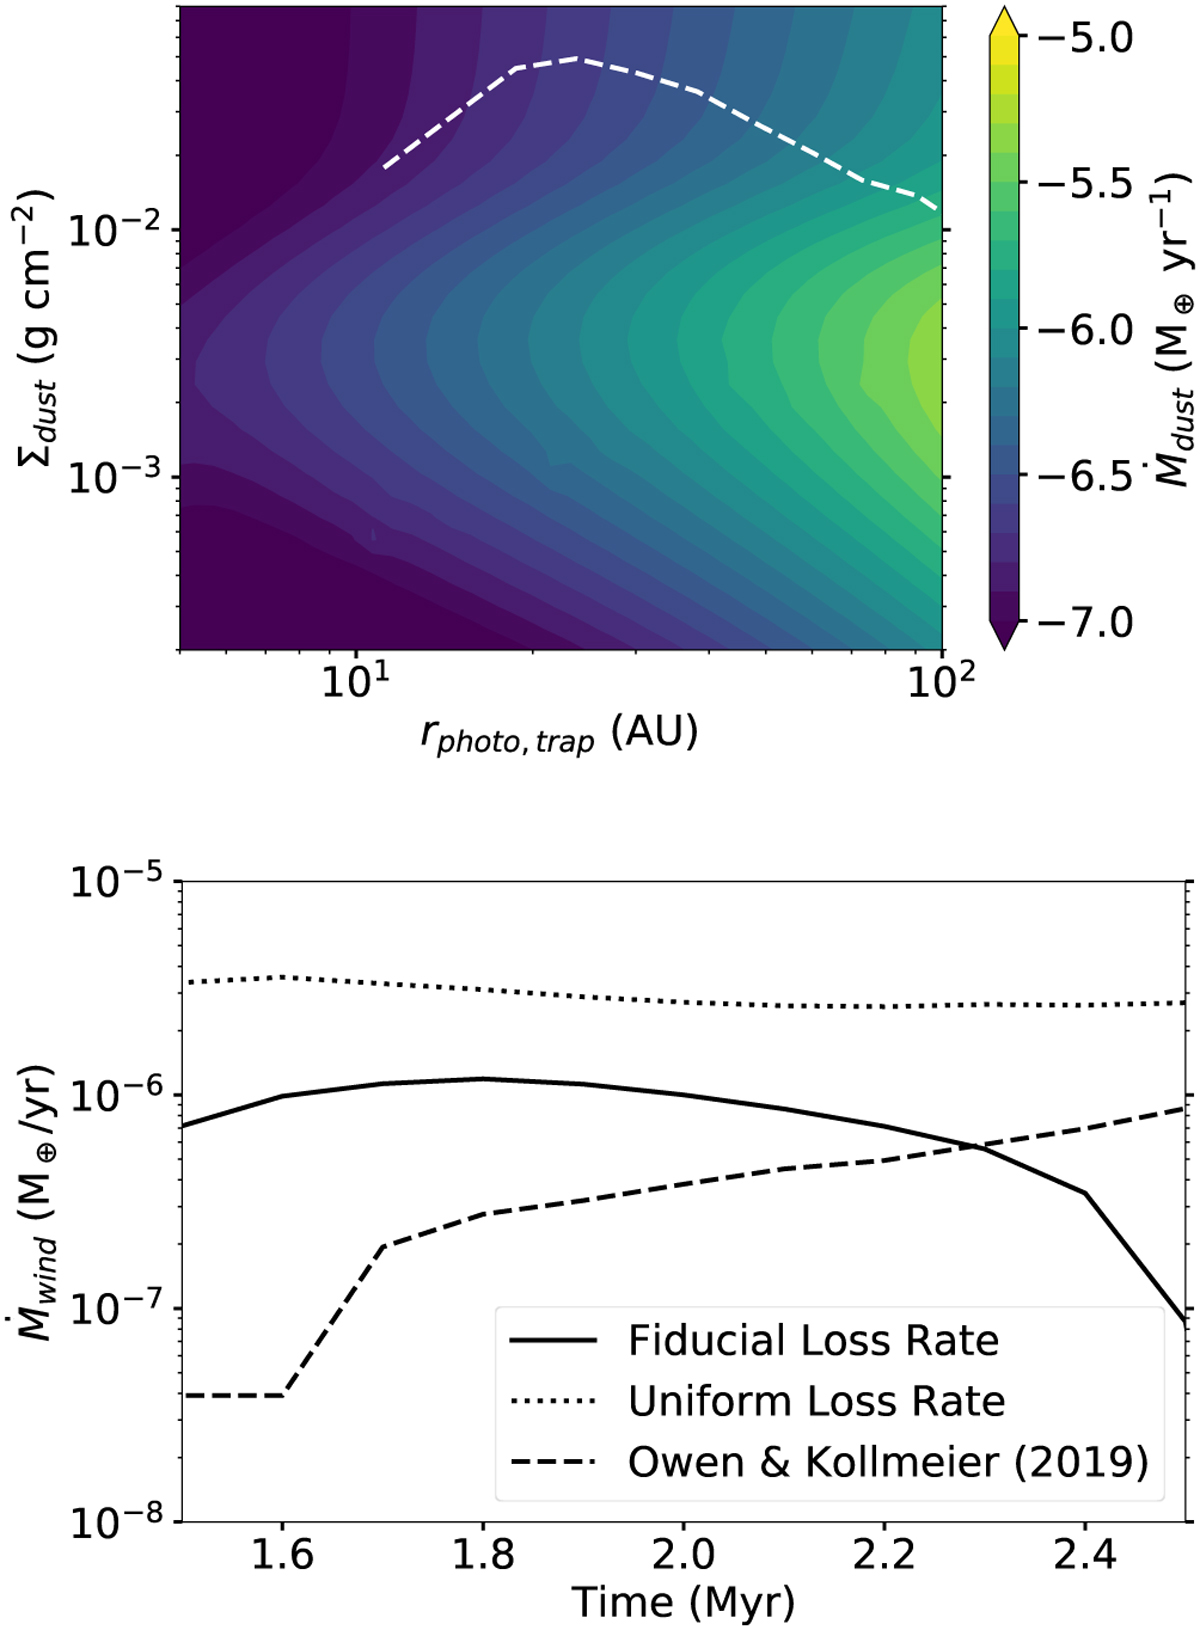
Fig. A.5
Download original image
Top: Mass loss rates from Owen & Kollmeier (2019, Figure 6) due to radiation pressure, with the photoevaporative trap location and dust surface density evolution of our fiducial model plotted on top (dashed line). Bottom: Mass loss rates for the fiducial smooth disk model (solid), the disk model with uniform entrainment (ϵw = ϵ, dotted), and the estimated loss rates from the Owen & Kollmeier (2019) radiation pressure (dashed), given our fiducial model properties.
Current usage metrics show cumulative count of Article Views (full-text article views including HTML views, PDF and ePub downloads, according to the available data) and Abstracts Views on Vision4Press platform.
Data correspond to usage on the plateform after 2015. The current usage metrics is available 48-96 hours after online publication and is updated daily on week days.
Initial download of the metrics may take a while.