Fig. 1
Download original image
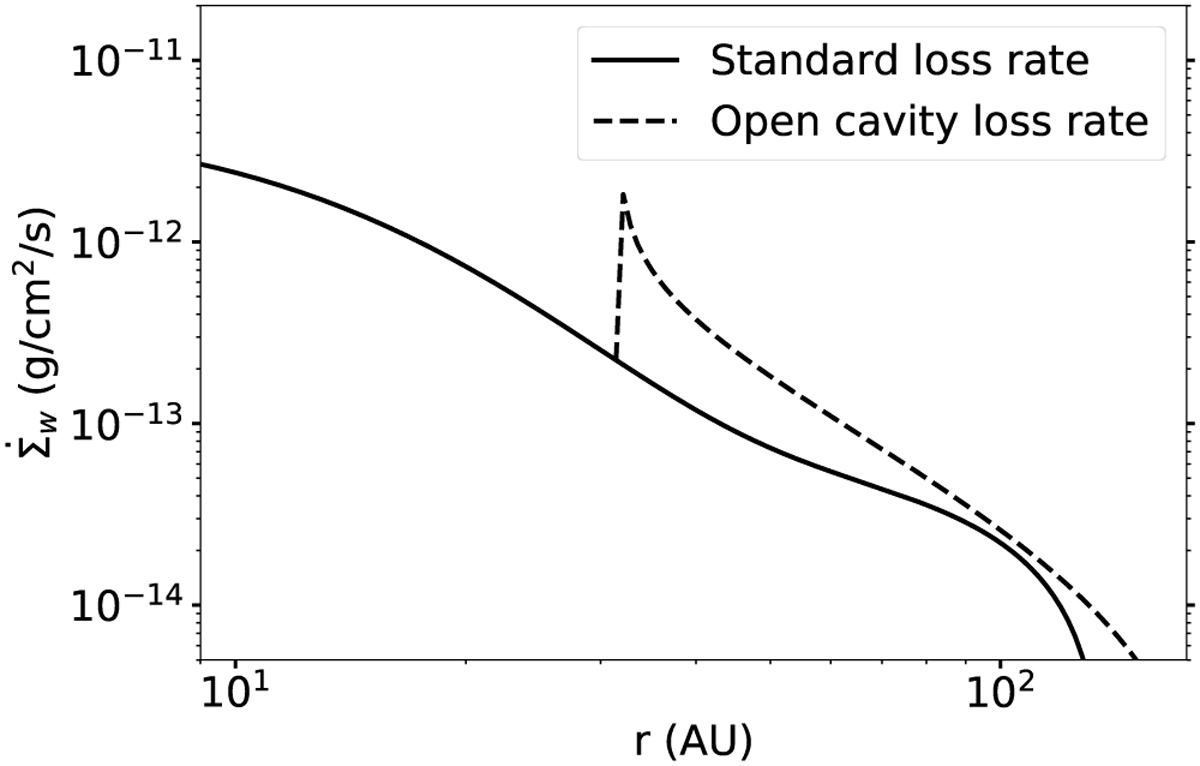
Example of the gas loss rate profile, following the photoevaporation model from Picogna et al. (2019, their Eqs. (2) and (4)), for Lx = 1030 erg s−1. The figure shows the mass loss rate before the photoevap-orative cavity opens (solid line) and after the photoevaporative cavity opens (dashed line), with the cavity edge located at rcavity ≈ 30 AU after 1.9 Myr of evolution.
Current usage metrics show cumulative count of Article Views (full-text article views including HTML views, PDF and ePub downloads, according to the available data) and Abstracts Views on Vision4Press platform.
Data correspond to usage on the plateform after 2015. The current usage metrics is available 48-96 hours after online publication and is updated daily on week days.
Initial download of the metrics may take a while.