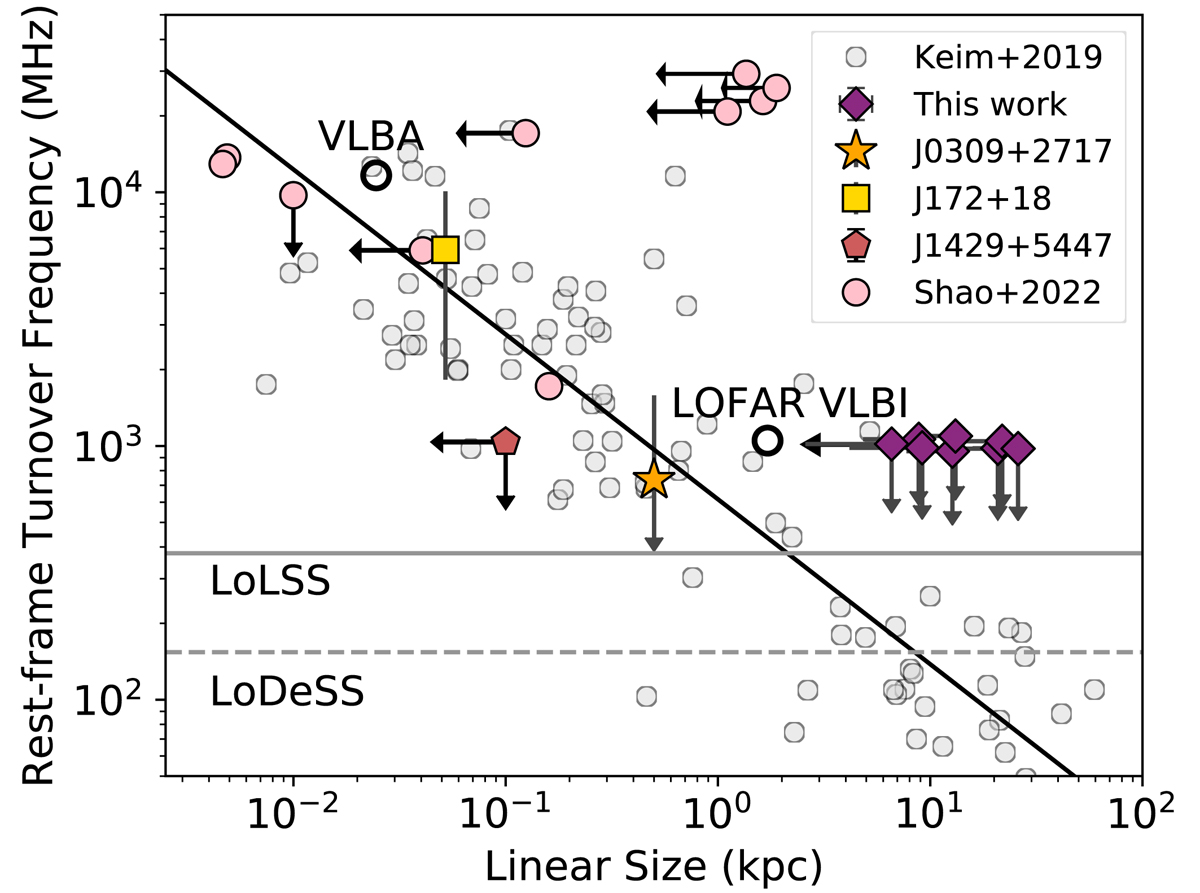
Fig. 5.
Download original image
Linear sizes versus rest-frame turnover frequency for the quasars in our sample, J172+18, and the 10 high-z quasars from Shao et al. (2022). The grey points show low-redshift (z ≈ 0.1 − 2) peaked spectrum sources from Keim et al. (2019), which follow a tight relation given by the black solid line (see Keim et al. 2019). Apart from J0309+2717, we have only upper limits on the linear sizes of the quasars in our sample and their turnover frequencies. Five of the quasars from Shao et al. (2022) have been observed at mas resolution with the VLBA and three of them have size measurements, which seem to follow the low-z relation. The solid and dashed grey lines show the frequencies of the LoLSS and LoDeSS survey, respectively, and the black open circles the resolution of the LOFAR VLBI and VLBA at 150 MHz and 1.6 GHz (observed frame).
Current usage metrics show cumulative count of Article Views (full-text article views including HTML views, PDF and ePub downloads, according to the available data) and Abstracts Views on Vision4Press platform.
Data correspond to usage on the plateform after 2015. The current usage metrics is available 48-96 hours after online publication and is updated daily on week days.
Initial download of the metrics may take a while.