Fig. 4.

Download original image
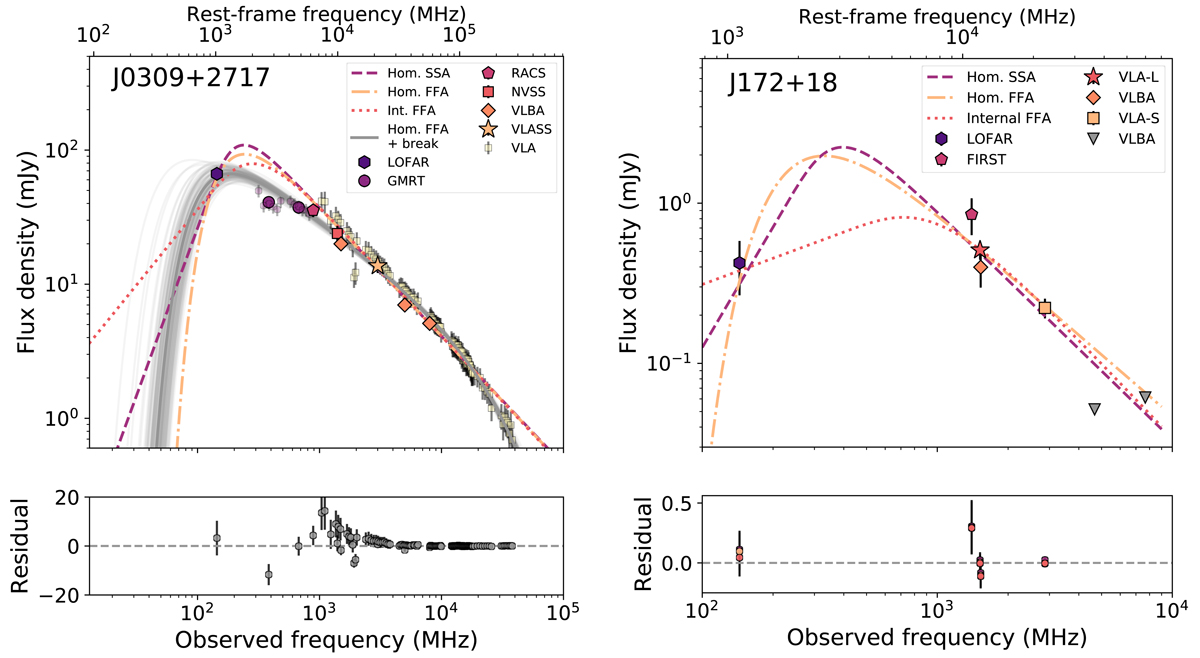
Radio spectra of J0309+2717 (left) and J172+18 (right) including reported literature radio flux density measurements. Left: the GMRT subband flux densities of the band 3 and 4 observations are shown in light purple. The VLBA and VLA measurements have been provided by Spingola et al. (2020). The dashed, dash-dotted and dotted line show the best fitting homogeneous SSA, homogeneous FFA, and internal FFA models, respectively. The homogeneous FFA with a break due to an ageing electron population (grey line) gives the best fit to the spectrum with a reduced χ2 of 0.6 and ΔBIC > 6 compared to all other models. Randomly selected MCMC fits are shown in light grey to visualize the uncertainty in the model fit with the parameters given in Table C.1. The bottom plot shows the residual of the homogeneous FFA model with a break. Right: the VLA-L and -S observations have been conducted by Bañados et al. (2021) and the VLBA observations by Momjian et al. (2021). Upper limits are given for the LOFAR at 144 MHz and the VLBA observations at 4.67 and 7.67 GHz. Due to a limited number of data points between 150 MHz and 1 GHz the absorption models remain unconstrained. However, we can conclude that the spectrum likely peaks between 0.25 and 1.3 GHz (rest-frame 2−10 GHz), meaning it can be classified as a GPS source. Again the residuals are shown in the bottom panel.
Current usage metrics show cumulative count of Article Views (full-text article views including HTML views, PDF and ePub downloads, according to the available data) and Abstracts Views on Vision4Press platform.
Data correspond to usage on the plateform after 2015. The current usage metrics is available 48-96 hours after online publication and is updated daily on week days.
Initial download of the metrics may take a while.


