Fig. 9
Download original image
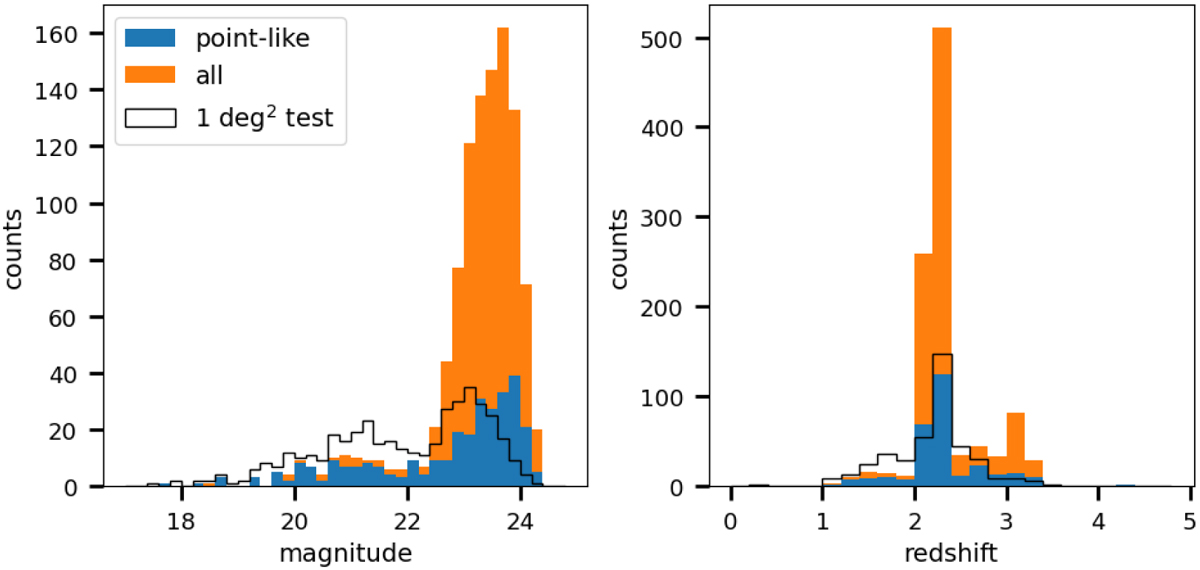
Solid histograms show distribution of magnitude (left) and redshift (right) for the quasar candidates for the ‘point-like’ and ‘all’ samples (see Table 1). Both distributions look similar, except for a peak at z ~ 3, present only when extended sources are included, suggesting the code might also work for extended sources. For comparison, empty histograms show the same distributions for the 1 deg2 test sample. We note that the redshift used here is the best trial redshift for each candidate.
Current usage metrics show cumulative count of Article Views (full-text article views including HTML views, PDF and ePub downloads, according to the available data) and Abstracts Views on Vision4Press platform.
Data correspond to usage on the plateform after 2015. The current usage metrics is available 48-96 hours after online publication and is updated daily on week days.
Initial download of the metrics may take a while.