Fig. 5
Download original image
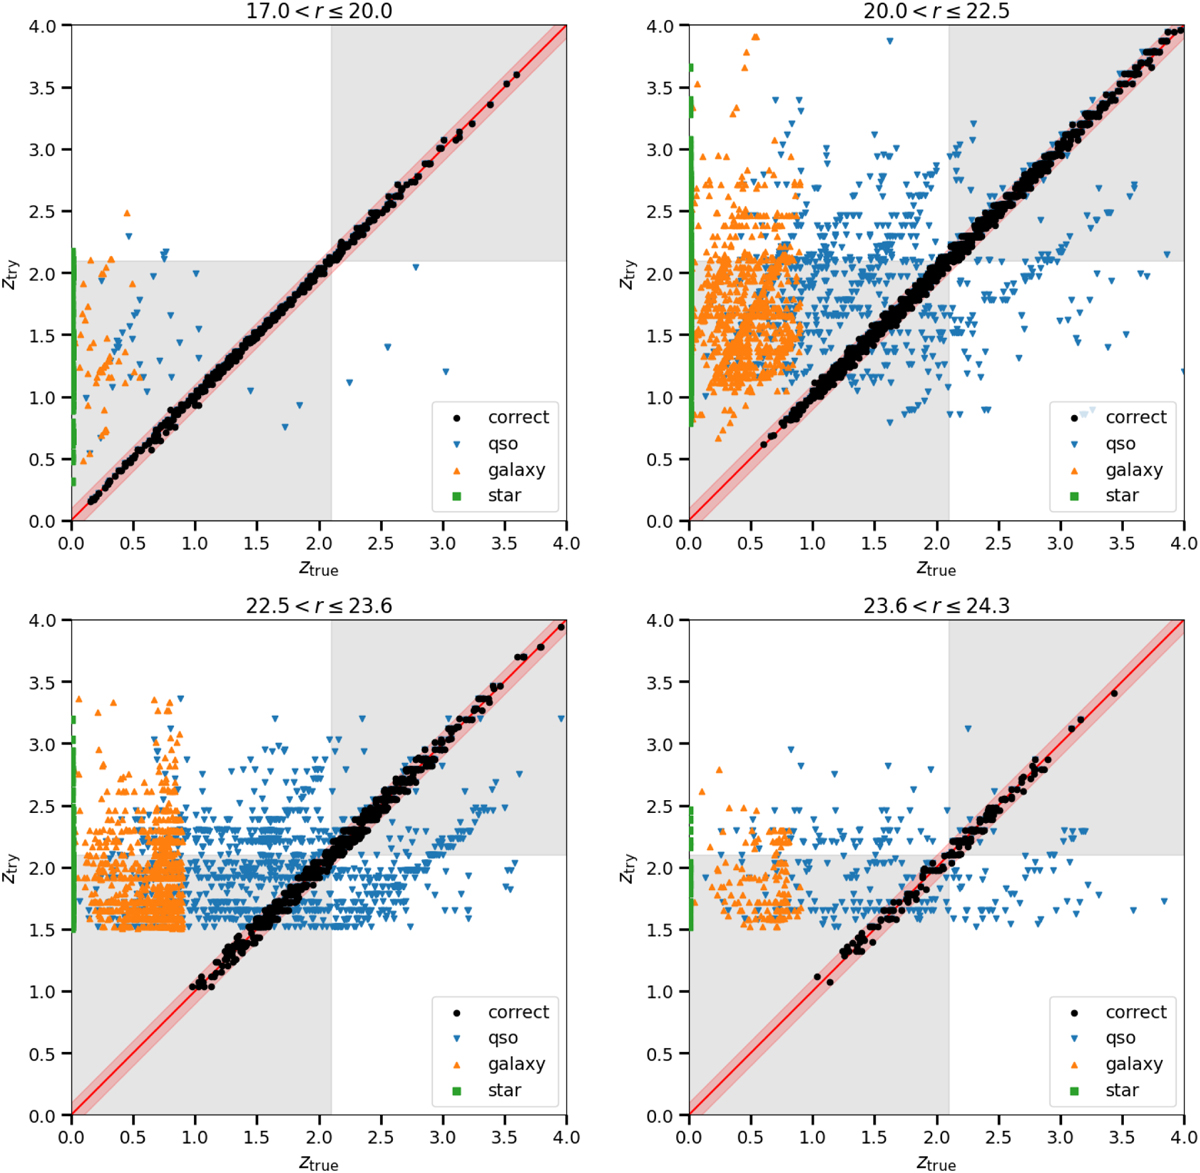
SQUEzE trial redshift, ztry, versus true redshift, ztrue, for the test sample. Black dots indicate correct classifications. Blue down-pointing triangles, orange up-pointing triangles, and green squares indicate the quasar, galactic, and stellar contaminants respectively. The red solid line shows the perfect classification line and the red stripe show the redshift offset tolerance (∆z = 0.10). Grey squares indicate the area where quasar contaminants are deemed as correct in the relaxed classification scheme (see text for details). From top to bottom and left to right, panels show the data split in four different magnitude bins: 17 < r ≤ 20, 20 < r ≤ 22.5, 22.5 < r ≤ 23.6, and 23.6 < r ≤ 24.3. We note that stellar contaminants (green dots) are always found at ztrue = 0.
Current usage metrics show cumulative count of Article Views (full-text article views including HTML views, PDF and ePub downloads, according to the available data) and Abstracts Views on Vision4Press platform.
Data correspond to usage on the plateform after 2015. The current usage metrics is available 48-96 hours after online publication and is updated daily on week days.
Initial download of the metrics may take a while.