Fig. 3
Download original image
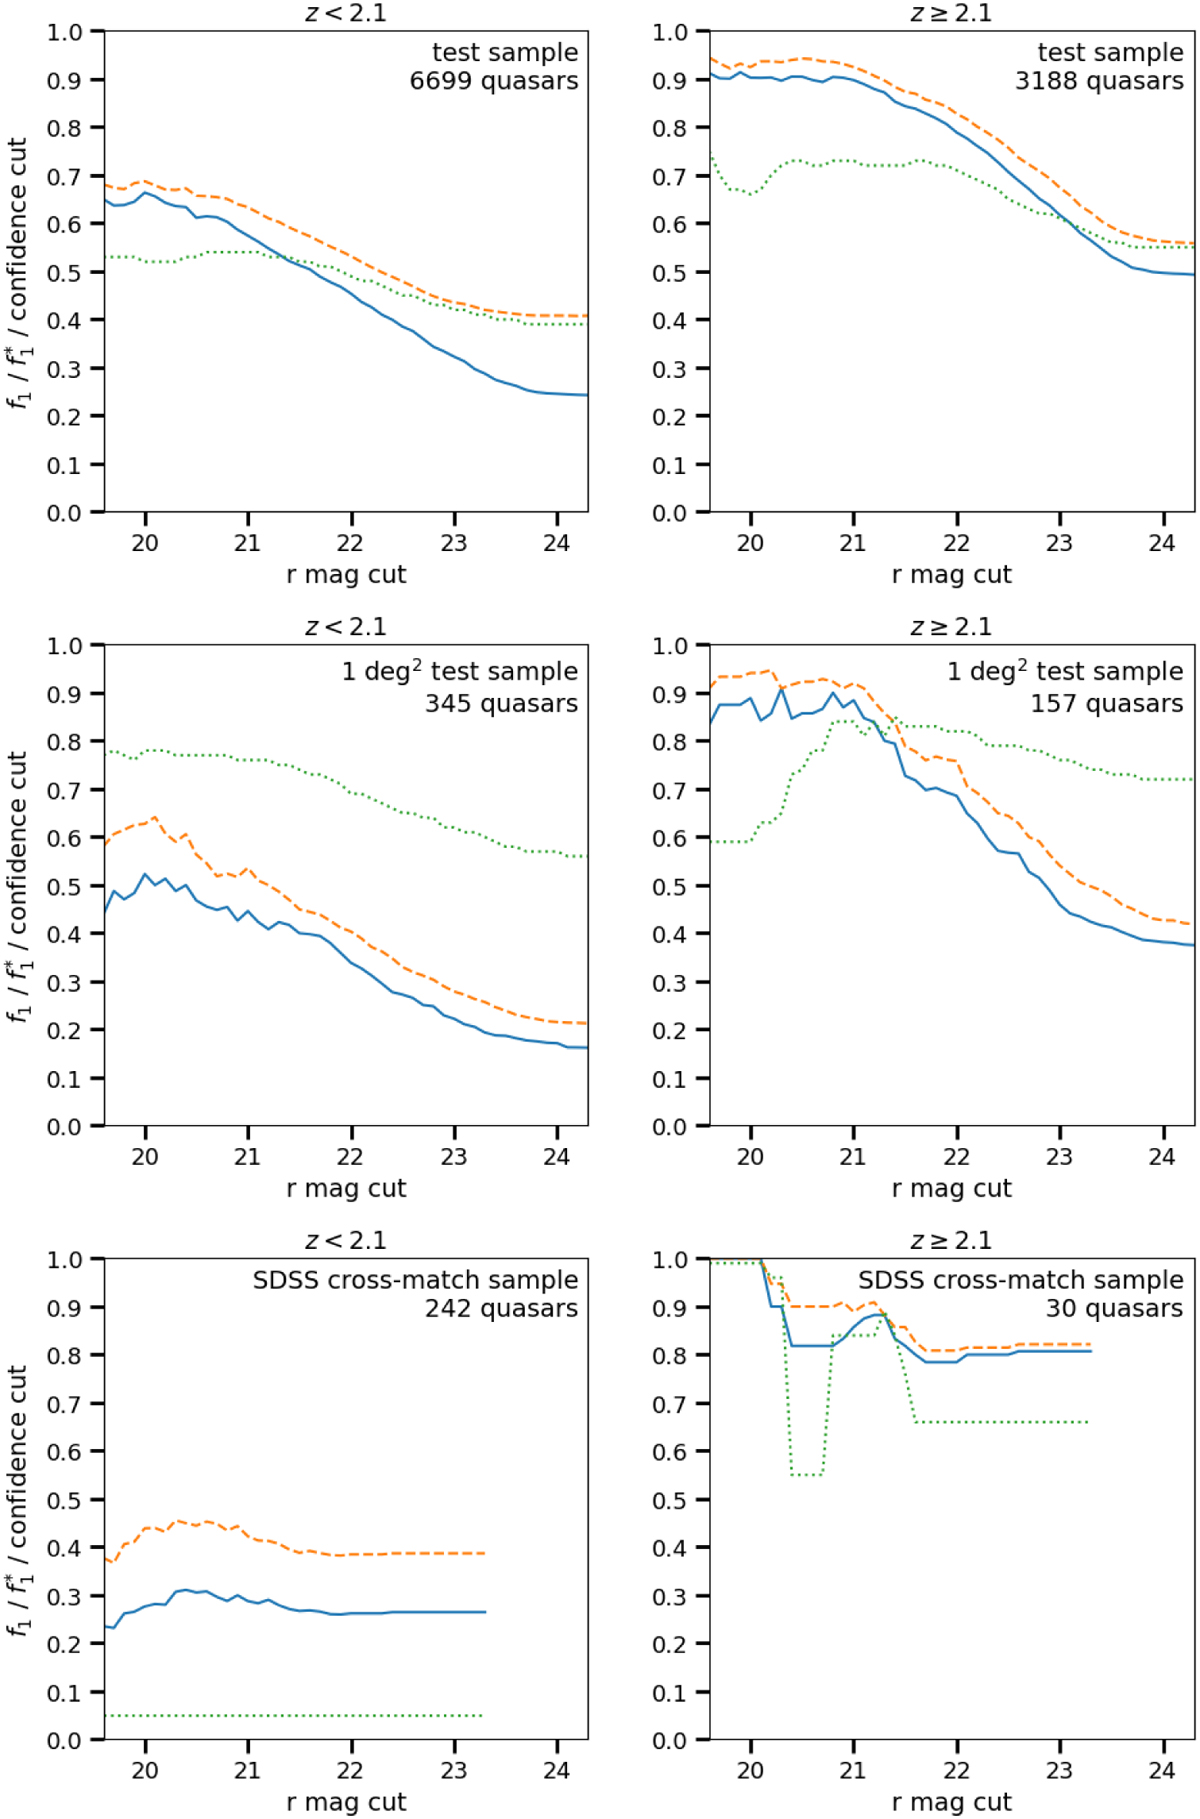
Performance as function of limiting magnitude. All objects brighter than the magnitude cut in the r band are considered to compute the f1 score. Blue solid lines show the f1 score as defined in Eq. (1), and the orange dashed lines show the more relaxed statistic ![]() (see text for details). Green dotted lines show the confidence threshold used to compute the f1 score. From top to bottom, we show results for the test sample (Sect. 4.1), the 1 deg2 test sample (Sect. 4.2), and the SDSS cross-match sample (Sect. 4.3). We note that in the bottom panels, the lines stop at magnitude 23.4; the sample does not have fainter objects.
(see text for details). Green dotted lines show the confidence threshold used to compute the f1 score. From top to bottom, we show results for the test sample (Sect. 4.1), the 1 deg2 test sample (Sect. 4.2), and the SDSS cross-match sample (Sect. 4.3). We note that in the bottom panels, the lines stop at magnitude 23.4; the sample does not have fainter objects.
Current usage metrics show cumulative count of Article Views (full-text article views including HTML views, PDF and ePub downloads, according to the available data) and Abstracts Views on Vision4Press platform.
Data correspond to usage on the plateform after 2015. The current usage metrics is available 48-96 hours after online publication and is updated daily on week days.
Initial download of the metrics may take a while.