Fig. C.4
Download original image
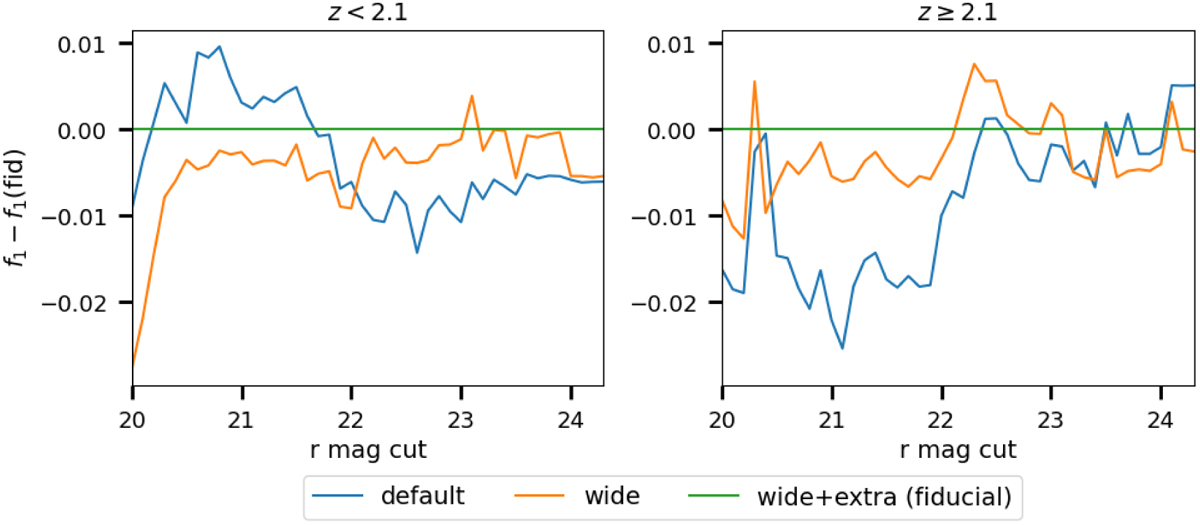
Comparison of SQUEzE performance (f1 score) when using the default set of line bands and the two new sets of line bands (using wider bands and using both wider bands and some extra bands), specified in Table C.2. Both cases are computed with a minimum peak significance of 2. The left (right) panel shows the performance for the low (high) redshift quasars. The fiducial model, using the wide+extra line bands is the best performing.
Current usage metrics show cumulative count of Article Views (full-text article views including HTML views, PDF and ePub downloads, according to the available data) and Abstracts Views on Vision4Press platform.
Data correspond to usage on the plateform after 2015. The current usage metrics is available 48-96 hours after online publication and is updated daily on week days.
Initial download of the metrics may take a while.