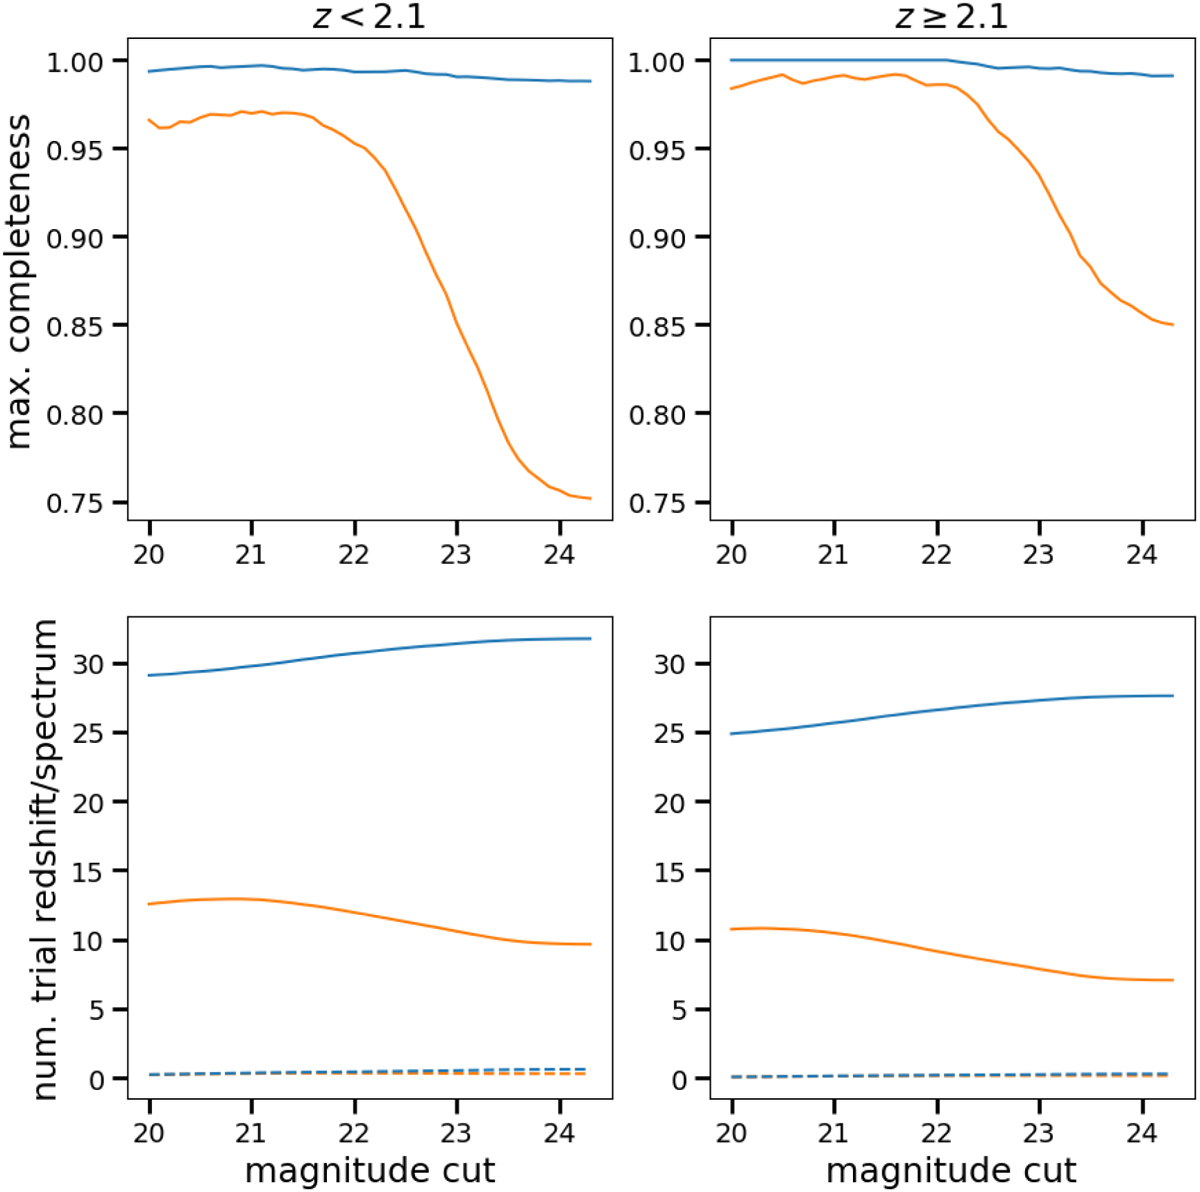
Fig. B.2
Download original image
Top panels show level of completeness after peak finder step. The bottom panels show the number of peaks per spectrum as solid lines and the number of correct peaks per spectrum as dashed lines. To compute the latter, only spectra of quasars are counted, whereas to compute the former all spectra are considered. The results for the old (new) peak finder are shown via blue (orange) lines.
Current usage metrics show cumulative count of Article Views (full-text article views including HTML views, PDF and ePub downloads, according to the available data) and Abstracts Views on Vision4Press platform.
Data correspond to usage on the plateform after 2015. The current usage metrics is available 48-96 hours after online publication and is updated daily on week days.
Initial download of the metrics may take a while.