Fig. B.1
Download original image
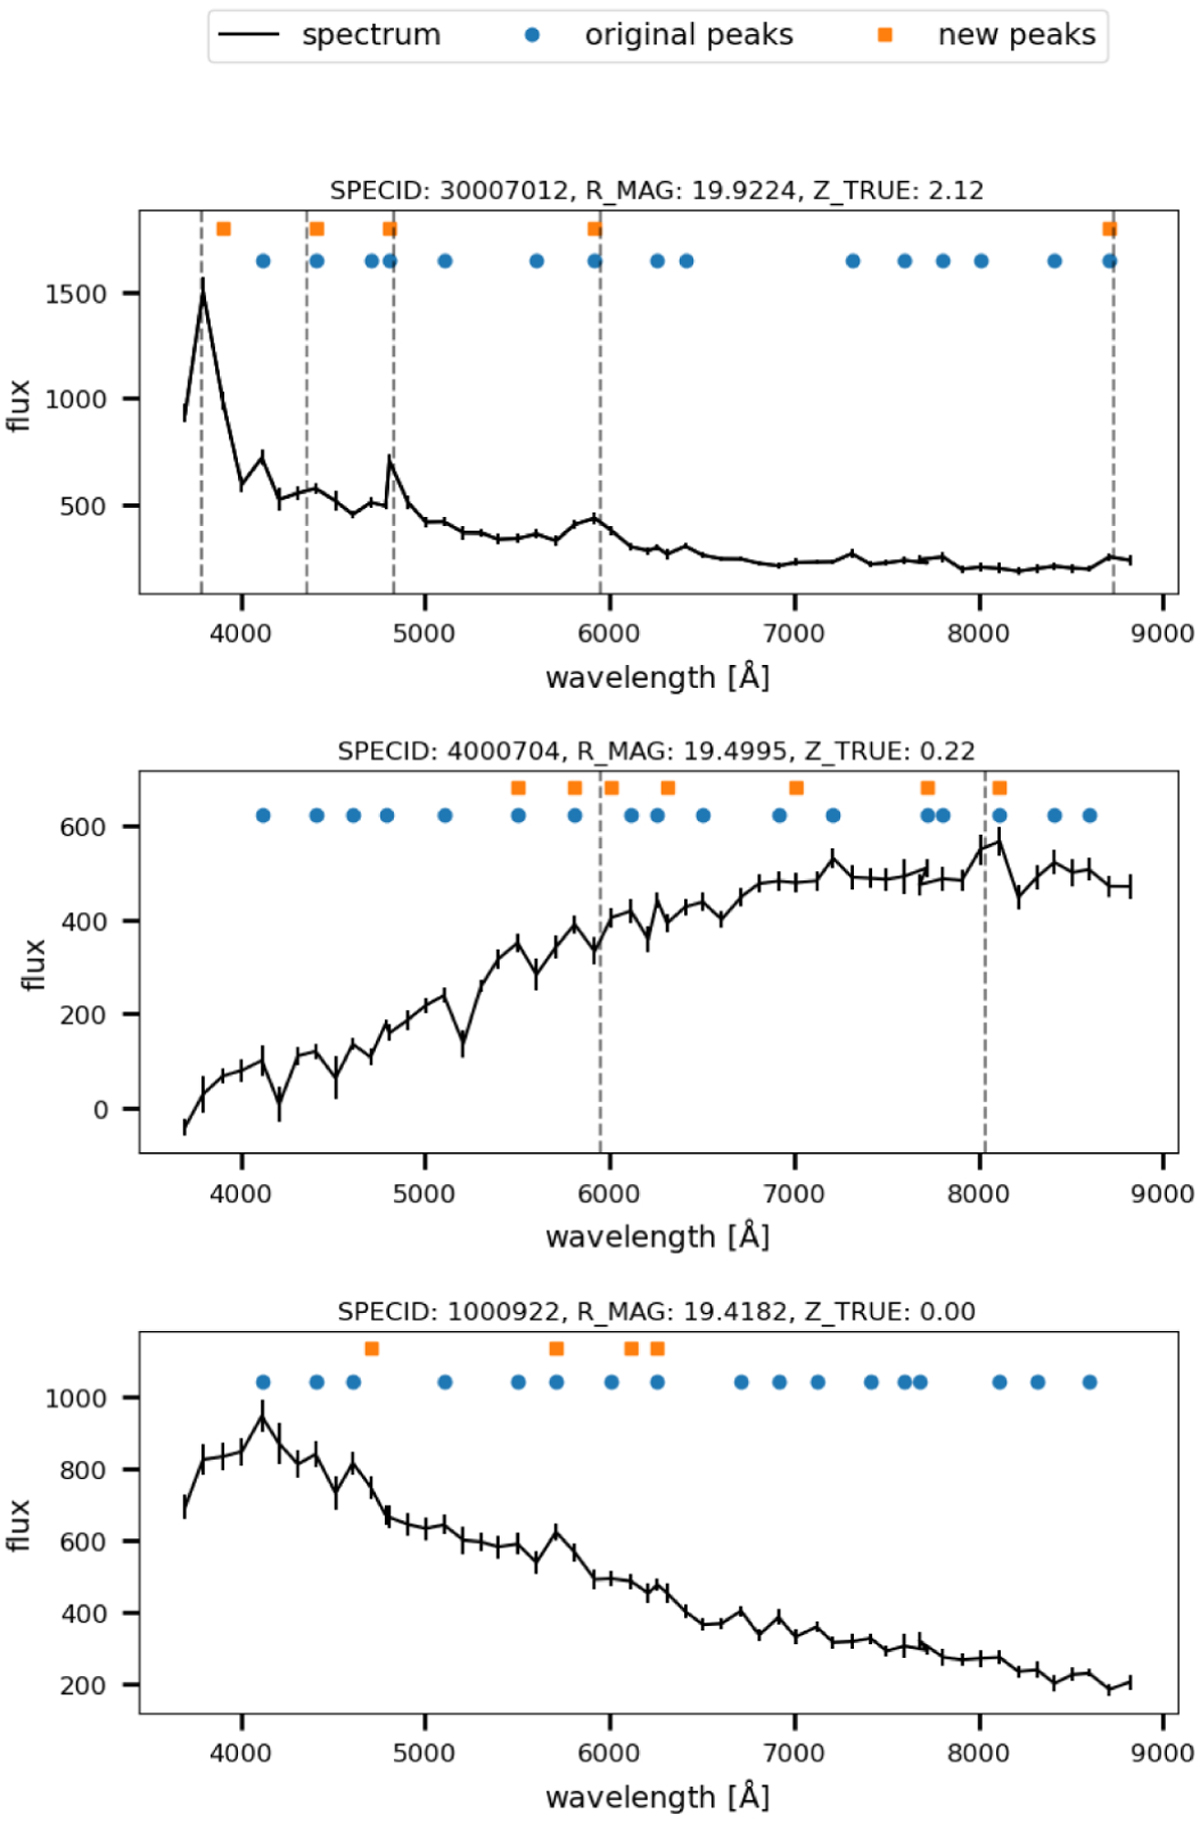
Example of performance of new peak finder compared to the original one. To illustrate the difference between peak finders, we show a quasar with magnitude r = 19.9224 and redshift of z = 2.12 (top panel), a galaxy with magnitude r = 19.4995 and redshift of z = 0.07 (mid panel), and a star with magnitude r = 19.4182. Blue circles show the peaks as detected by the original peak finder. Orange squares are the peaks detected by the new peak finder. Dashed lines indicate the expected position of the main emission lines. For the quasar, from left to right, they indicate the Lyα, Si IV, C IV, C III], and Mg II. For the galaxy, also from left to right, they indicate the O [III] and Hα.
Current usage metrics show cumulative count of Article Views (full-text article views including HTML views, PDF and ePub downloads, according to the available data) and Abstracts Views on Vision4Press platform.
Data correspond to usage on the plateform after 2015. The current usage metrics is available 48-96 hours after online publication and is updated daily on week days.
Initial download of the metrics may take a while.