Open Access
Fig. A.1
Download original image
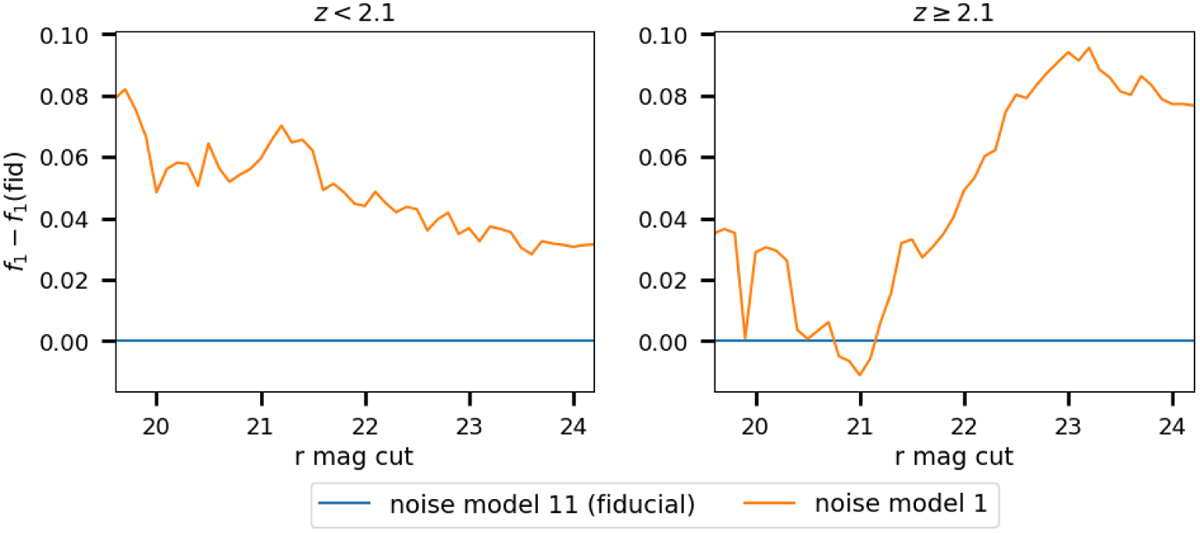
Change in the f1 score when different noise models are used to generate the mocks. Note that the change is applied both to the train and the test samples. The left (right) panel shows the performance for the low (high) redshift quasars.
Current usage metrics show cumulative count of Article Views (full-text article views including HTML views, PDF and ePub downloads, according to the available data) and Abstracts Views on Vision4Press platform.
Data correspond to usage on the plateform after 2015. The current usage metrics is available 48-96 hours after online publication and is updated daily on week days.
Initial download of the metrics may take a while.