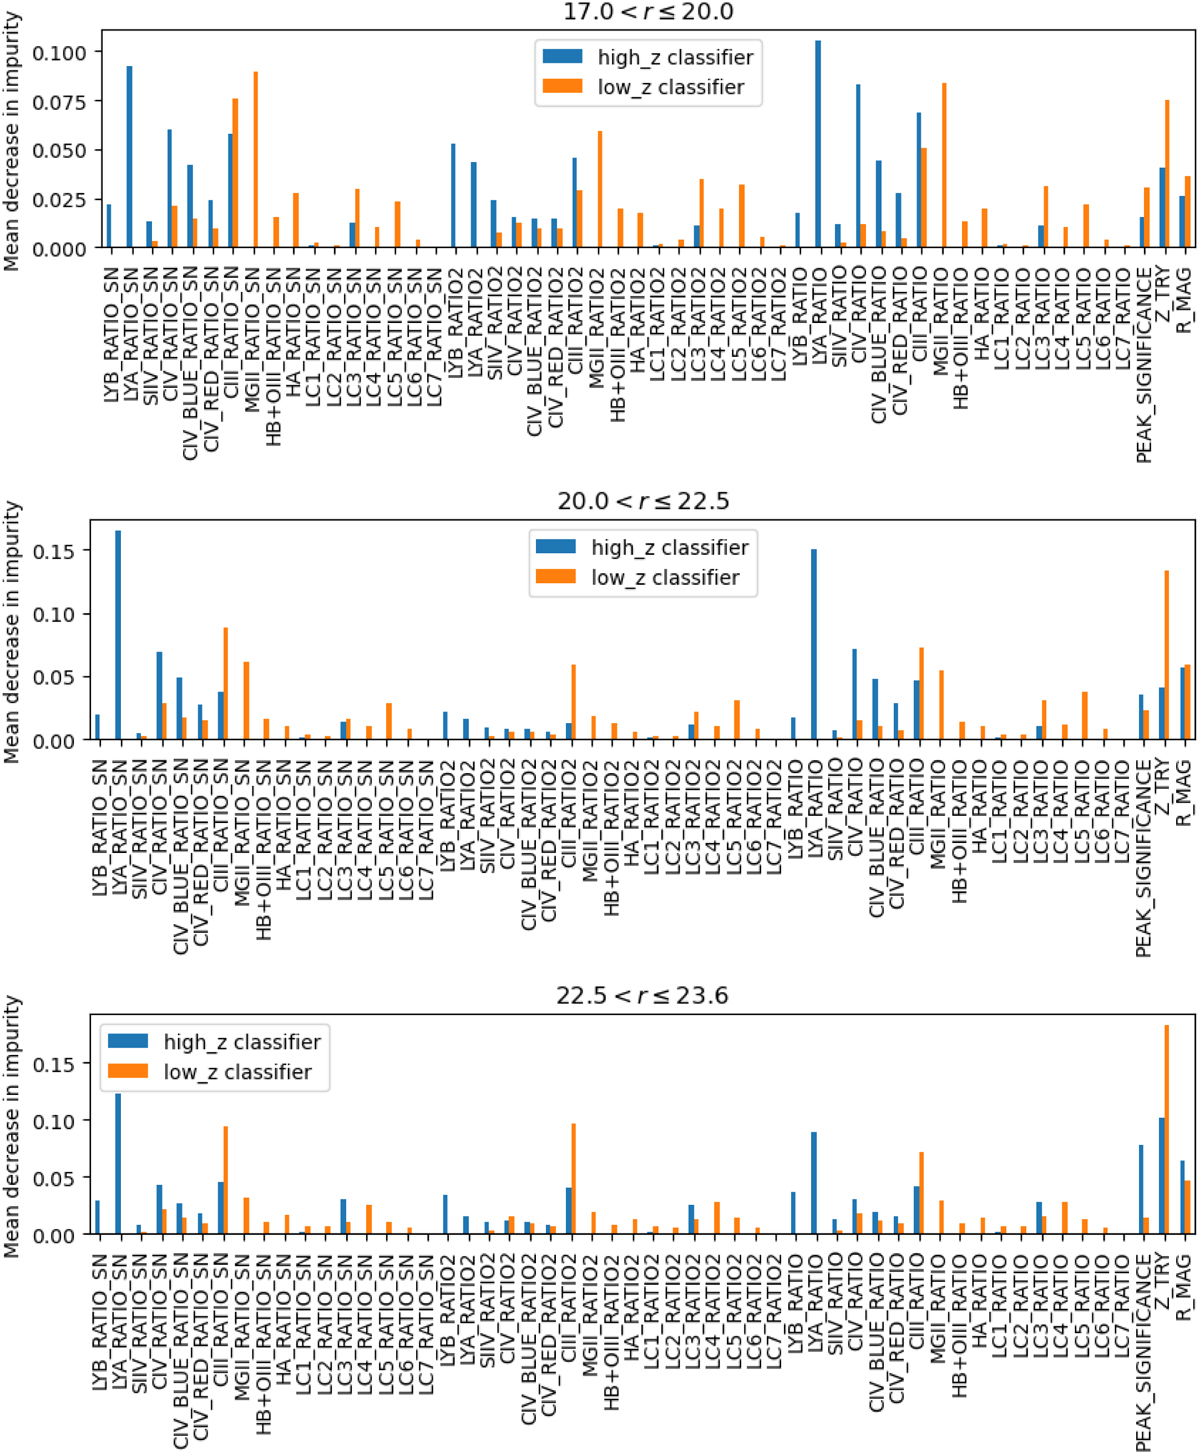
Fig. 11
Download original image
Feature importance analysis performed on SQUEzE training based on the mean decrease in impurity. Higher values indicate that the feature is more important. From top to bottom, the different panels show the result for the first three magnitude bins, with 17 < r ≤ 20, 20 < r ≤ 22.5, and t22.5 < r ≤ 23.6. The results for the remaining magnitude bin are shown in Fig. 12.
Current usage metrics show cumulative count of Article Views (full-text article views including HTML views, PDF and ePub downloads, according to the available data) and Abstracts Views on Vision4Press platform.
Data correspond to usage on the plateform after 2015. The current usage metrics is available 48-96 hours after online publication and is updated daily on week days.
Initial download of the metrics may take a while.