Open Access
Fig. 10
Download original image
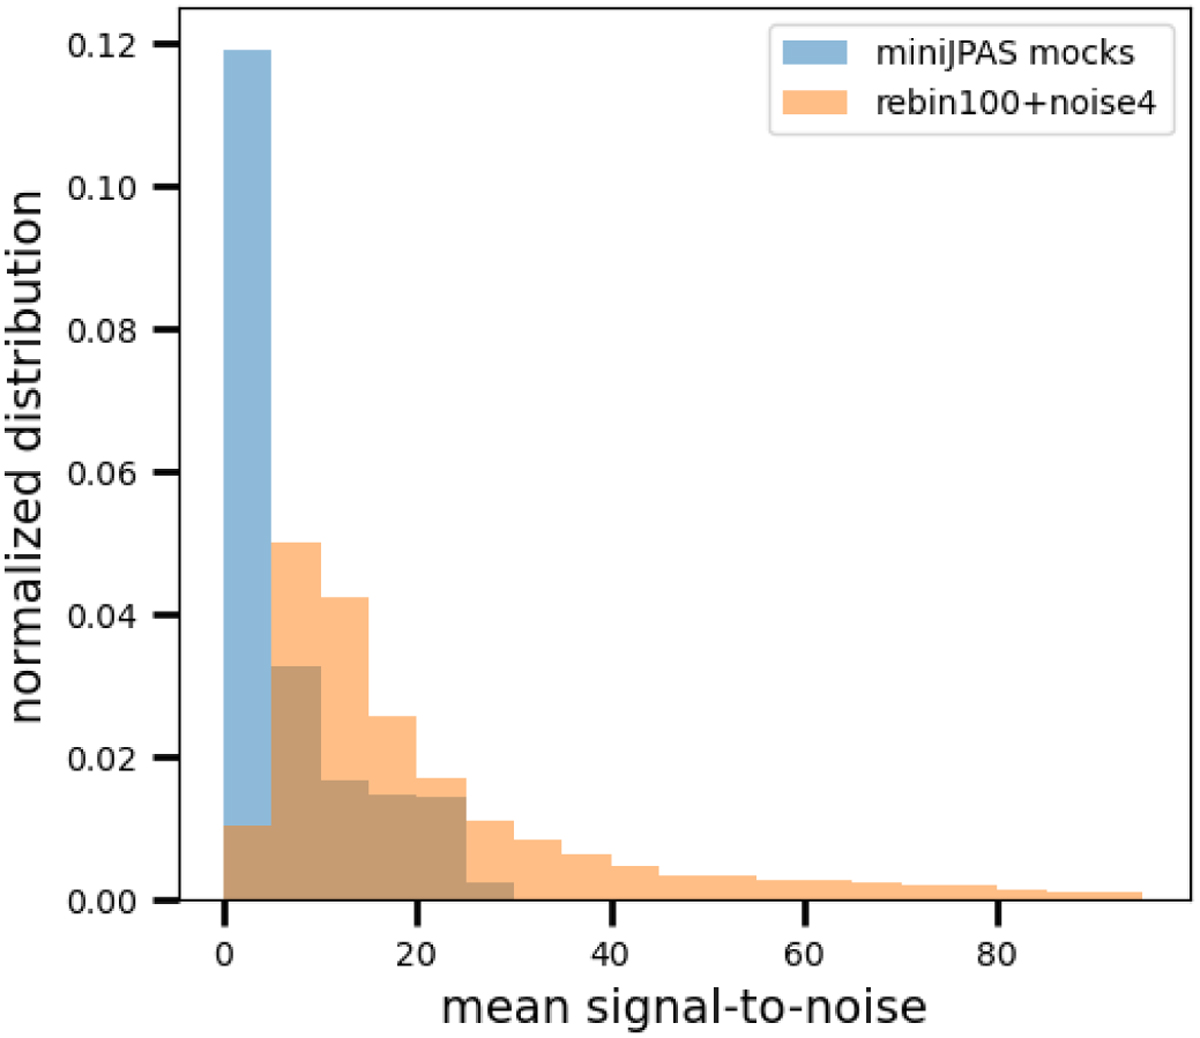
Normalised distributions of the mean signal-to-noise ratio for the spectra of the test sample (blue) and the rebuilt test sample (orange). We rebuilt the test sample following the Pérez-Ràfols et al. (2020) prescription for building the rebin100+noise4 mocks.
Current usage metrics show cumulative count of Article Views (full-text article views including HTML views, PDF and ePub downloads, according to the available data) and Abstracts Views on Vision4Press platform.
Data correspond to usage on the plateform after 2015. The current usage metrics is available 48-96 hours after online publication and is updated daily on week days.
Initial download of the metrics may take a while.