Fig. 9
Download original image
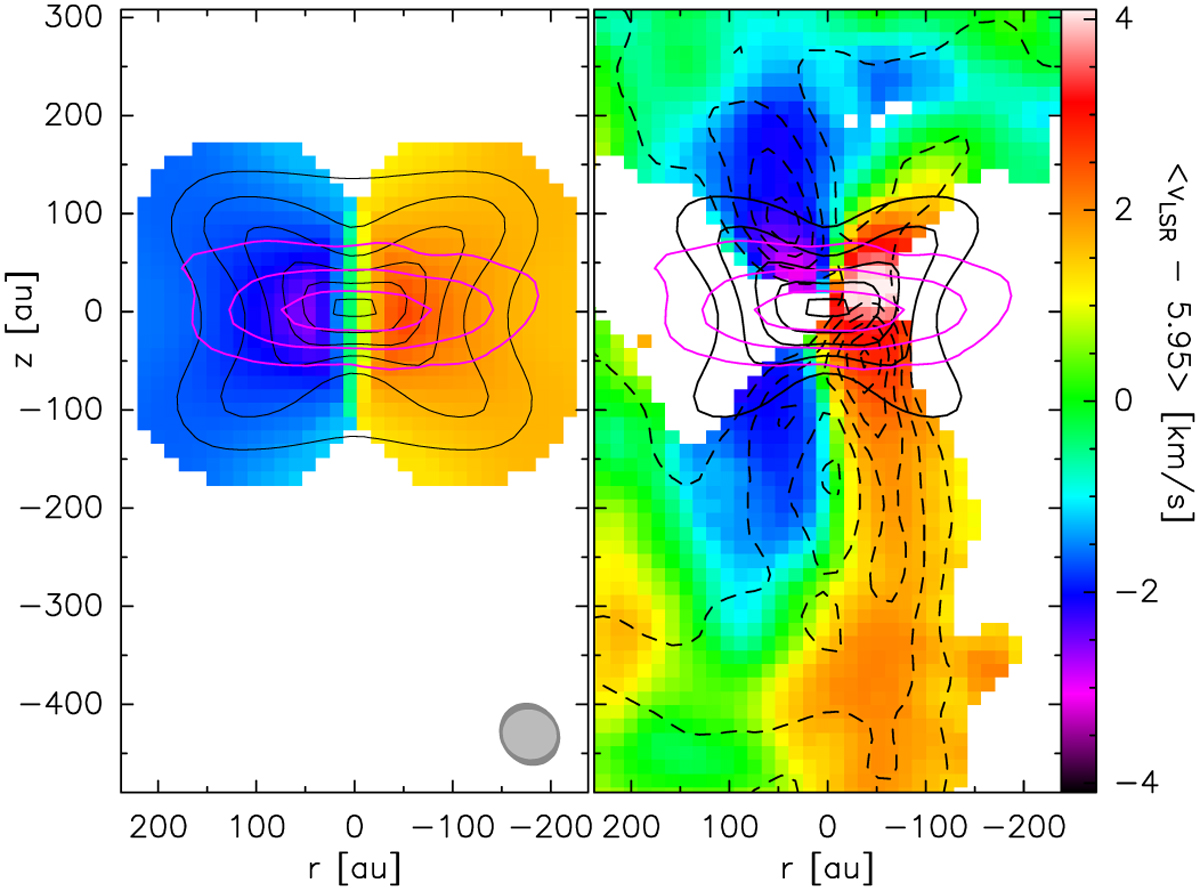
Mean velocity field (1st moment maps) of 12CO(2–1) in the velocity range ±6 km s−1 of the best-fit disk model (left; Table4 and Fig. A.2) and the residual CO emission after subtracting the disk model and masking the corrupted central velocity channels between ±1.2 km s−1 (right). Black solid contours show the total integrated intensity of the CO emission from the model disk. Magenta contours show the 230 GHz dust continuum emission from the disk at 2.5, 7.5, and 15 mJy beam−1. Dashed contours show the total integrated intensity of the residual CO emission. Synthesized FWHM beam sizes are shown as gray ellipses in the lower right corner (dark gray: CO, light gray: dust). The maps are rotated counterclockwise by 32° such that the disk and outflow axes are aligned with the z-axis.
Current usage metrics show cumulative count of Article Views (full-text article views including HTML views, PDF and ePub downloads, according to the available data) and Abstracts Views on Vision4Press platform.
Data correspond to usage on the plateform after 2015. The current usage metrics is available 48-96 hours after online publication and is updated daily on week days.
Initial download of the metrics may take a while.