Fig. 6
Download original image
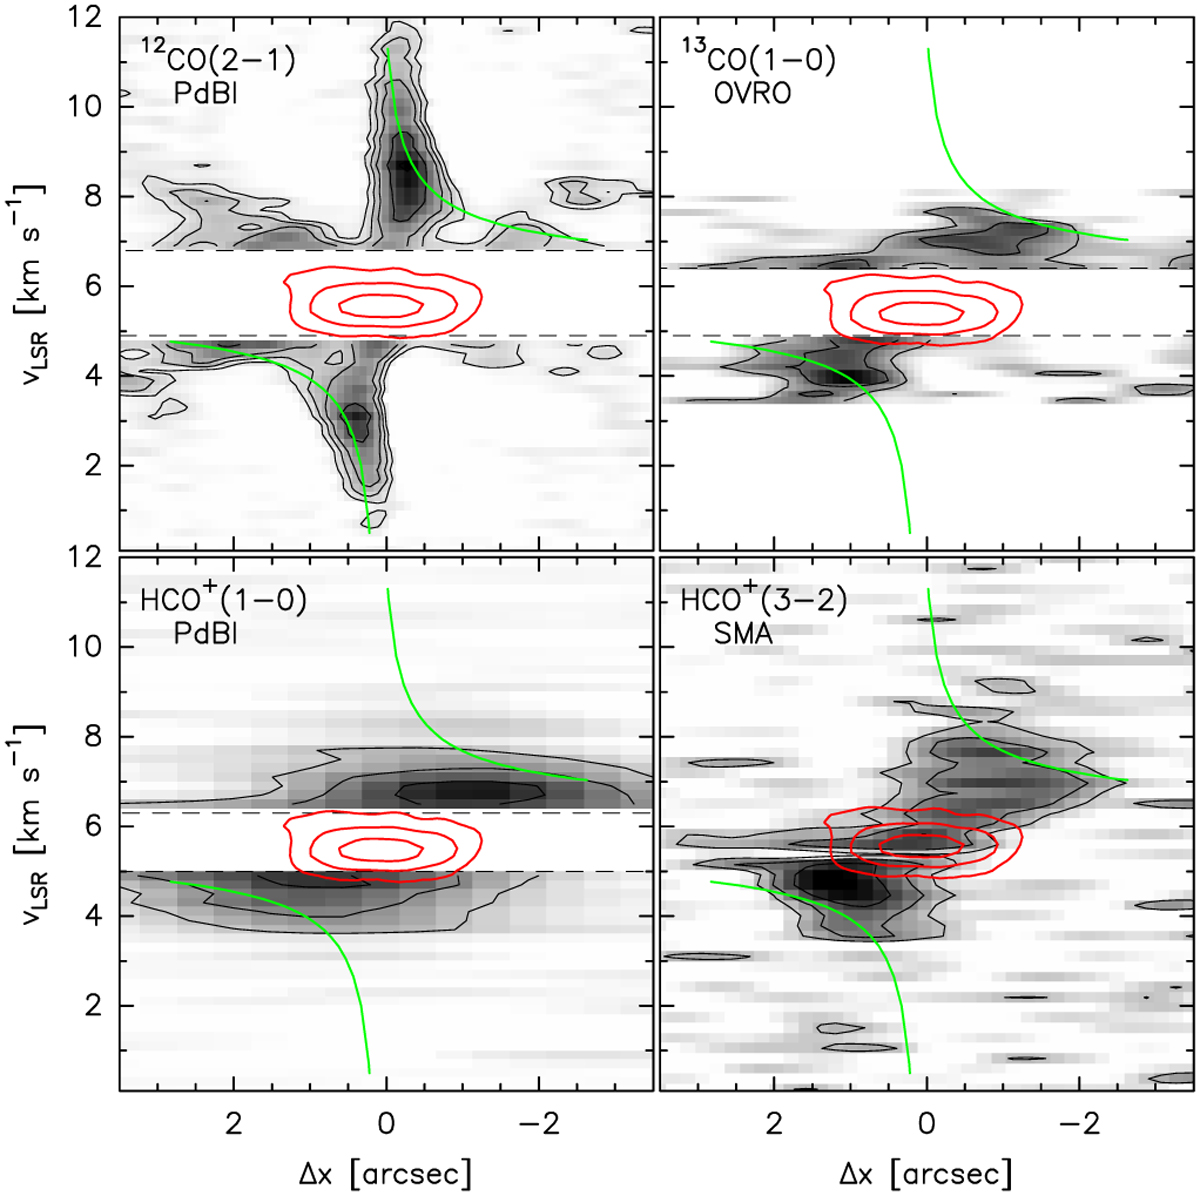
Position-velocity diagrams along the plane of the disk of 12CO(2–1), 13CO(1–0), HCO+ (1–0), and HCO+ (3–2). Contours start at 3σ. Except for HCO+ (3–2), the envelope-dominated central velocity channels were masked out for the analysis (see also Figs. A.1, A.4 and A.5). Overlaid as red contours for comparison (with the y-axis being ∆y instead of υLSR) is the 230 GHz dust continuum emission from the disk (2.5, 7.5, and 15 mJy beam−1), rotated by 32°. Green lines show the Keplerian rotation curve for a central mass of 0.55 M⊙ and systemic velocity of υ0 = 5.95 km s−1 (only to guide the eye; this is not the fit to the data).
Current usage metrics show cumulative count of Article Views (full-text article views including HTML views, PDF and ePub downloads, according to the available data) and Abstracts Views on Vision4Press platform.
Data correspond to usage on the plateform after 2015. The current usage metrics is available 48-96 hours after online publication and is updated daily on week days.
Initial download of the metrics may take a while.