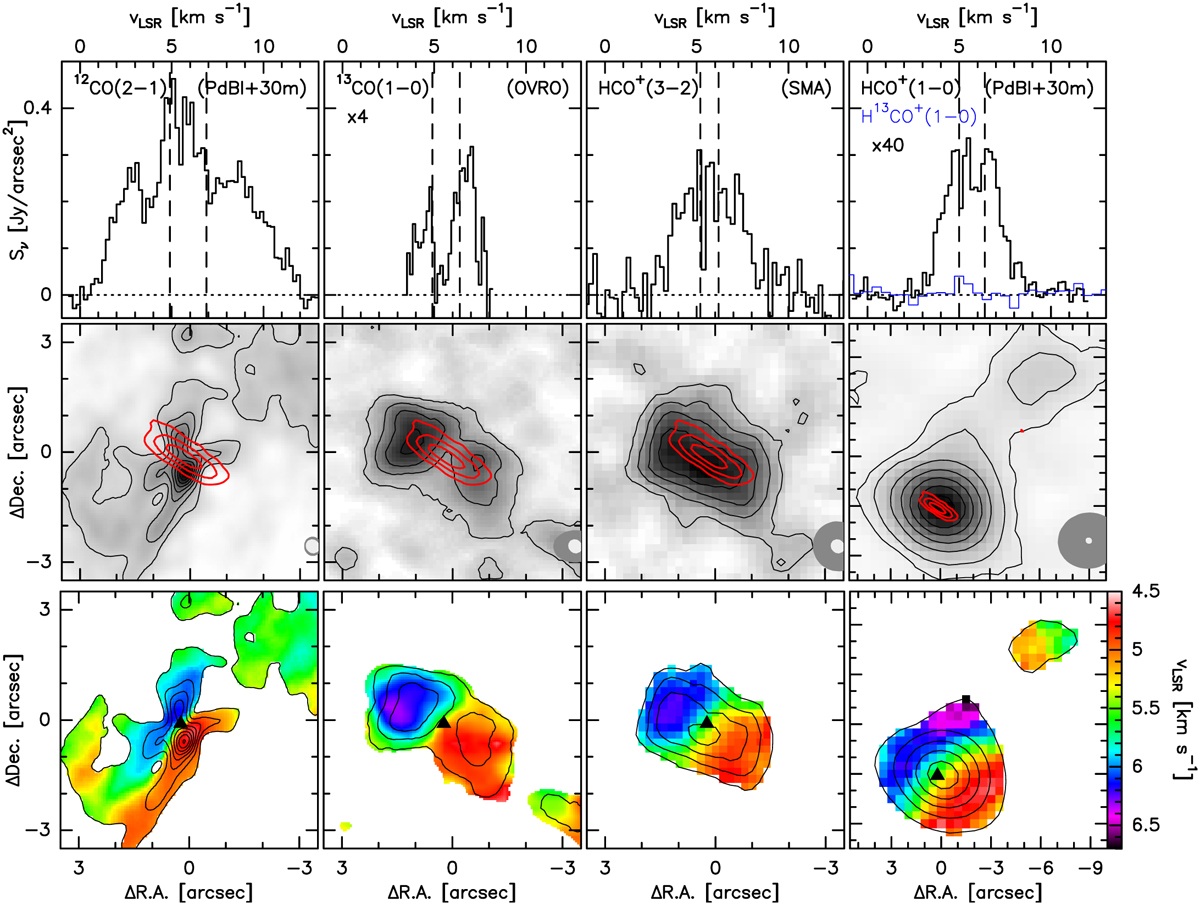
Fig. 3
Download original image
Line spectra of CB 26, integrated over ≈1.5 beams around the disk center (top row), integrated intensity maps (middle row), and mean velocity fields (1st moment maps, bottom row). From left to right: 12CO (2–1) (0.5–4.8 and 7.0–12.0 km s−1), 11 CO (1–0) (3.4–4.9 and 6.2–7.7 km s−1), HCO+ (3–2) (1–10 km s−1), and HCO+ (1–0) and H13 CO+ (1–0) in blue (2.0–5.0 and 6.3–9.0 km s−1). Dashed vertical lines in the spectra (top) indicate the velocity range within which the spectra are most strongly affected by resolved-out emission and self-absorption from the extended envelope (see Figs. A.1–A.5). Total intensity contours in the maps start at 3σ. Overlaid as red contours in the middle row at 2.5, 7.5, and 15 mJy beam−1 is the 230 GHz dust continuum emission from the disk. Synthesized FWHM beam sizes are shown as gray ellipses in the lower right corners (dark gray: line, light gray: continuum). The bottom panels show the respective 1st moment maps with contours of the total intensity overlaid. A black triangle marks the location of the central star (and center of the disk). We note that, except for HCO+ (3–2), the envelope-dominated central velocity channels were masked out before the moment maps where generated.
Current usage metrics show cumulative count of Article Views (full-text article views including HTML views, PDF and ePub downloads, according to the available data) and Abstracts Views on Vision4Press platform.
Data correspond to usage on the plateform after 2015. The current usage metrics is available 48-96 hours after online publication and is updated daily on week days.
Initial download of the metrics may take a while.