Fig. 11
Download original image
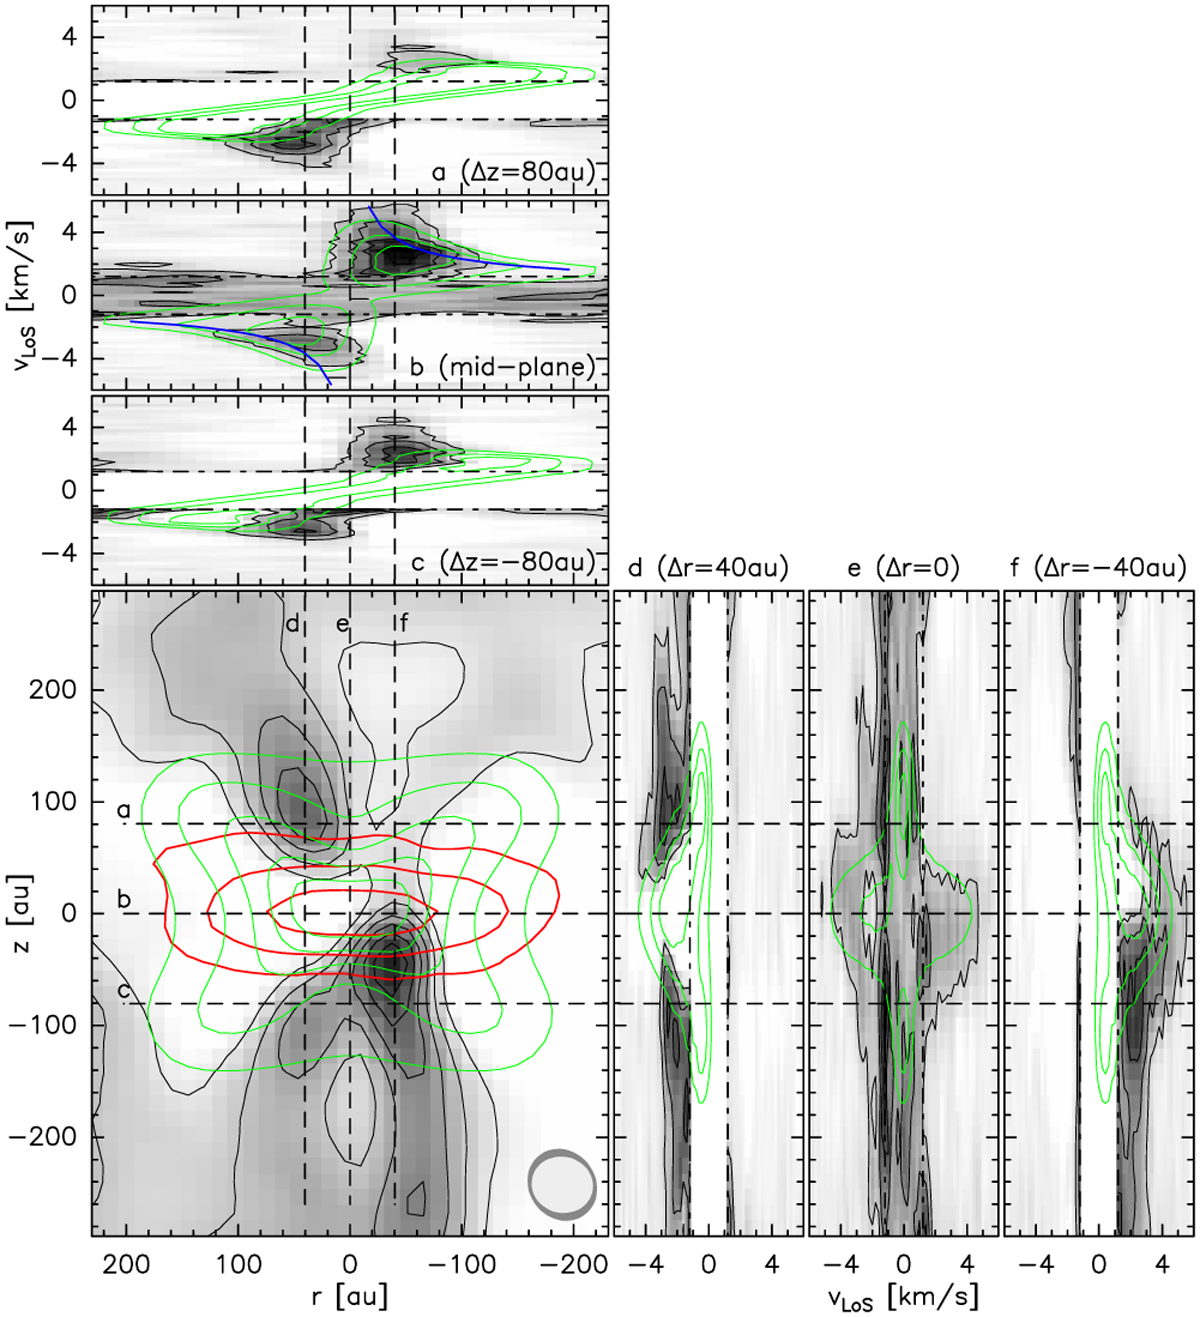
Bottom left: total intensity map (gray-scale and black solid contours) of the residual12CO (2−1) emission after subtracting the disk model and masking the corrupted central velocity channels between ±1.2 km s−1, integrated over the velocity range ±6 km s−1. Red contours show the observed 230GHz dust continuum emission from the disk at 2.5, 7.5, and 15 mJy beam−1. Green contours show the total integrated intensity of the CO emission from the model disk. Synthesized FWHM beam sizes are shown as gray ellipses in the lower right corner (dark gray: CO, light gray: dust). Top: position-velocity diagrams (PVD) of 12CO (2−1) at three cuts parallel to the plane of the disk (a, b, c, as indicated by dashed lines in the total intensity map; gray-scale and black contours). The middle panel shows the PVD of the unmasked total observed CO emission along the disk mid-plane, while the upper and lower panels show disk wind PVDs of the residual CO emission (after subtracting the disk model) and with the central corrupted velocity channels masked. Green contours show the PVDs of the disk CO model along the disk mid-plane. Bottom right: same as above, but for the three vertical cuts labeled d, e, and f. Green contours show the PVDs of the disk CO model along the same vertical cuts.
Current usage metrics show cumulative count of Article Views (full-text article views including HTML views, PDF and ePub downloads, according to the available data) and Abstracts Views on Vision4Press platform.
Data correspond to usage on the plateform after 2015. The current usage metrics is available 48-96 hours after online publication and is updated daily on week days.
Initial download of the metrics may take a while.