Fig. 10
Download original image
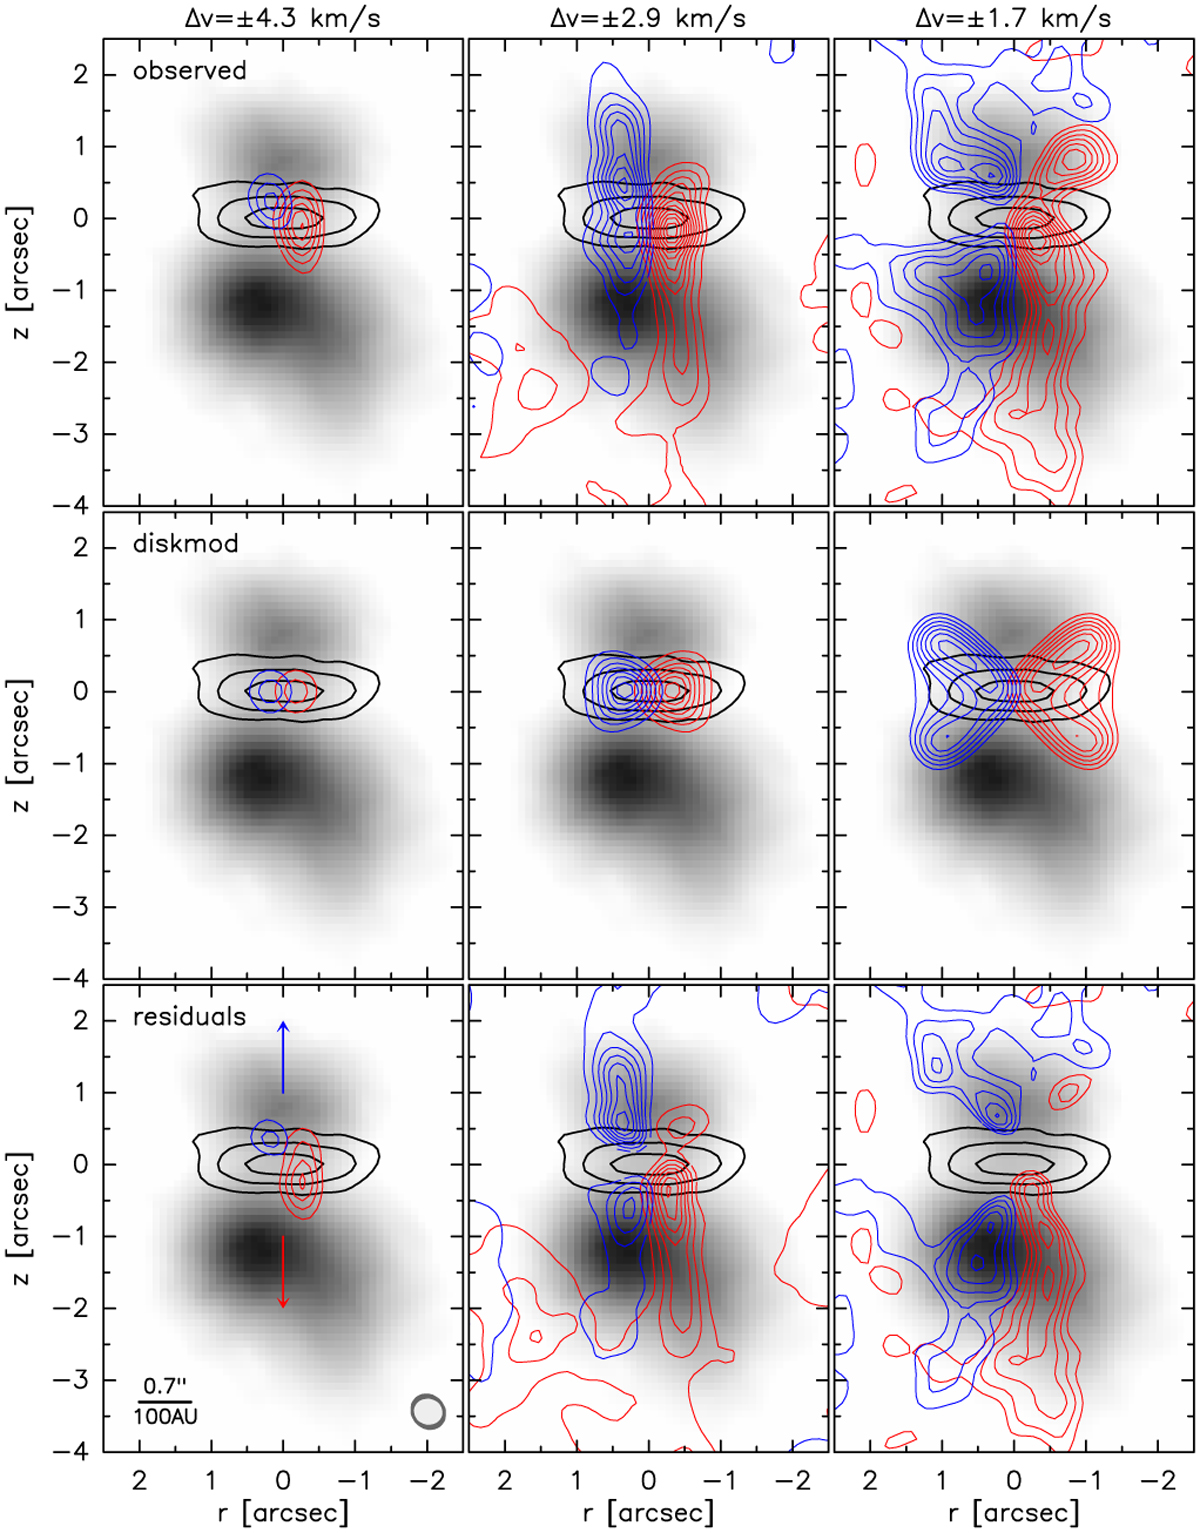
Channel maps of the12CO (2−1) emission in binned, 0.8 km s−1 wide channels around the velocity offsets Δυ from υ0 = 5.95 km s−1 indicated on top. Top row: observed total emission (see Fig. A.1); middle row: disk model (see Sect. 4.1 and Fig. A.2); bottom row: residuals, that is, observed total emission with disk model subtracted. Blue contours indicate negative velocity offsets, red contours positive ones. CO contours start at 15 mJy beam−1 (left and middle panels), and 40 mJy beam−1 (right panels) and are spaced by 15 mJy beam−1. Blue and red arrows in the lower left panel show the inclination orientation of the disk and outflow. Black contours show the 230 GHz dust continuum emission from the disk at 2.5, 7.5, and 15 mJy beam−1. Synthesized FWHM beam sizes are shown as gray ellipses in the lower right corner of the lower left panel (dark gray: CO, light gray: dust). The underlying gray-scale image shows the NIR K-band image of the bipolar reflection nebula (see Fig. 1).
Current usage metrics show cumulative count of Article Views (full-text article views including HTML views, PDF and ePub downloads, according to the available data) and Abstracts Views on Vision4Press platform.
Data correspond to usage on the plateform after 2015. The current usage metrics is available 48-96 hours after online publication and is updated daily on week days.
Initial download of the metrics may take a while.