Fig. 1
Download original image
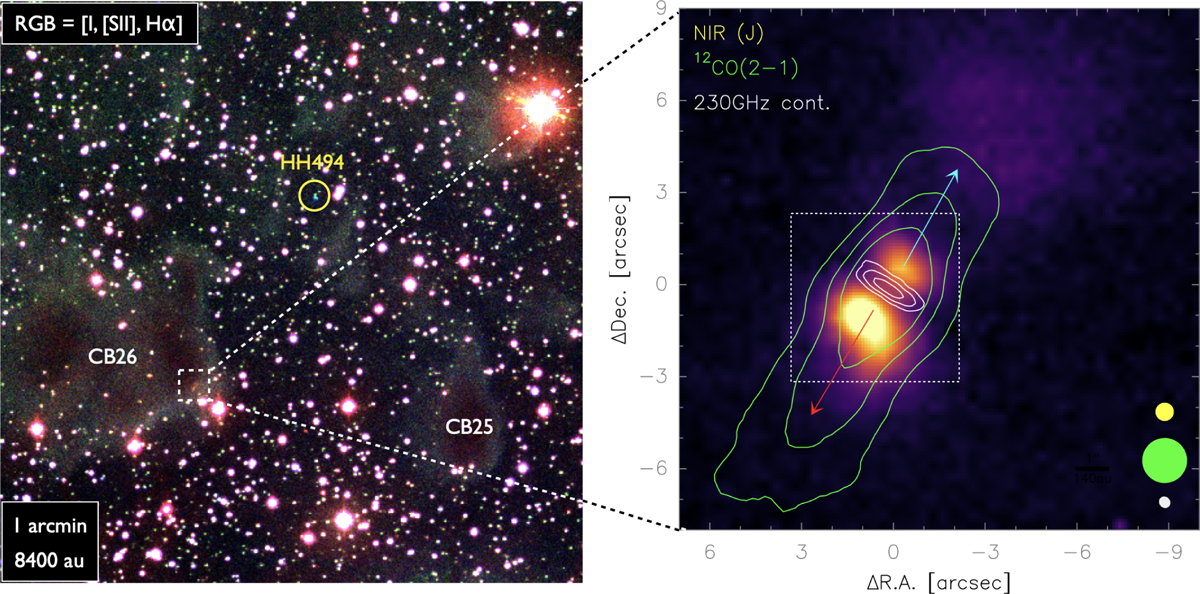
Overview of the CB 26 region. The left panel shows a wide-field optical “true-color” image, which is based on Hα (blue), [SII] (green), and I-band (red) images (Stecklum et al. 2004). The globules CB 25 and CB 26 as well as Herbig-Haro object HH494 are marked in the image. The zoomed-in right panel shows a NIR J-band image of the bipolar reflection nebula (color, 07 6 resolution), overlaid with contours of the 1.3 mm dust continuum emission from the disk (white contours at 3, 7.5, and 15 mJy beam−1). Green contours show the integrated 12CO(2–1) emission (0.5–12 km s−1) from the bipolar molecular outflow as presented in Launhardt et al. (2009). The red and blue arrows indicate the large-scale outflow orientation. Beam sizes are shown in respective colors in the lower right corner. The white dashed square marks the image section shown in Fig. 2. The reference position is 04h59m50.74s, 52°Q4′43.80″ (J2000).
Current usage metrics show cumulative count of Article Views (full-text article views including HTML views, PDF and ePub downloads, according to the available data) and Abstracts Views on Vision4Press platform.
Data correspond to usage on the plateform after 2015. The current usage metrics is available 48-96 hours after online publication and is updated daily on week days.
Initial download of the metrics may take a while.