Open Access
Fig. 9
Download original image
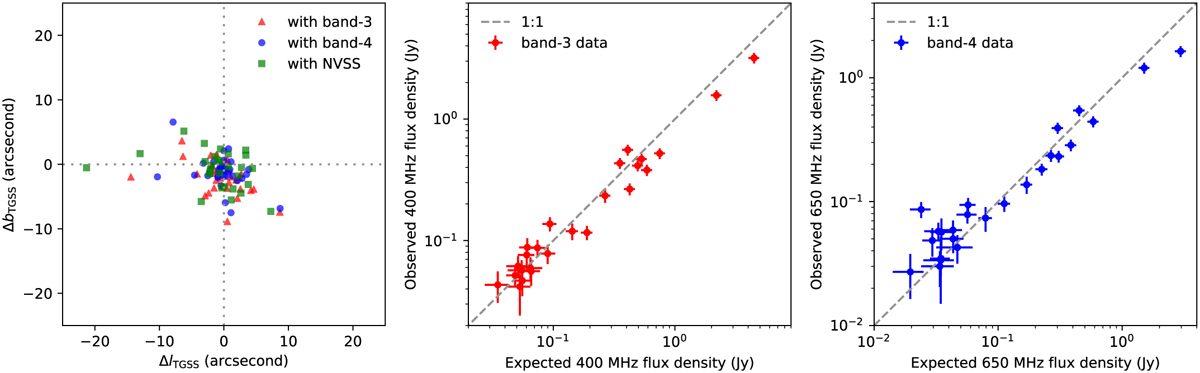
Position offsets of the TGSS sources seen in our survey and the NVSS, with obvious extended sources excluded (left). Observed and expected flux density comparison is shown for sources in band-3 (middle) and band-4 (right), where the expected flux density is obtained using spectral indices from de Gasperin et al. (2018).
Current usage metrics show cumulative count of Article Views (full-text article views including HTML views, PDF and ePub downloads, according to the available data) and Abstracts Views on Vision4Press platform.
Data correspond to usage on the plateform after 2015. The current usage metrics is available 48-96 hours after online publication and is updated daily on week days.
Initial download of the metrics may take a while.