Open Access
Fig. 8
Download original image
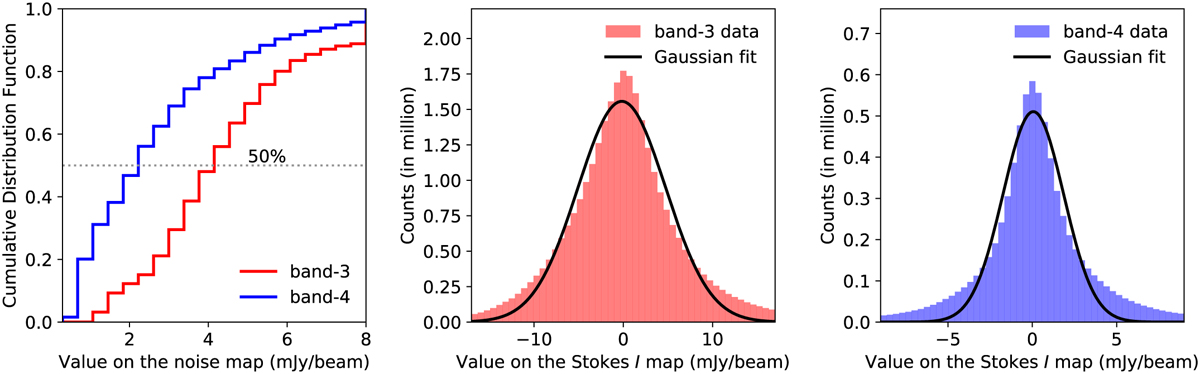
Cumulative distribution functions of the noise maps (left), the histograms of values of the pixels in the continuum mosaics of band-3 (middle), and band-4 (right). Gaussian least-squares fits are performed on the histograms, which gave standard deviations as ~4.9 mJy beam−1 for band-3 and ~1.8 mJy beam−1 for band-4.
Current usage metrics show cumulative count of Article Views (full-text article views including HTML views, PDF and ePub downloads, according to the available data) and Abstracts Views on Vision4Press platform.
Data correspond to usage on the plateform after 2015. The current usage metrics is available 48-96 hours after online publication and is updated daily on week days.
Initial download of the metrics may take a while.