Fig. 7
Download original image
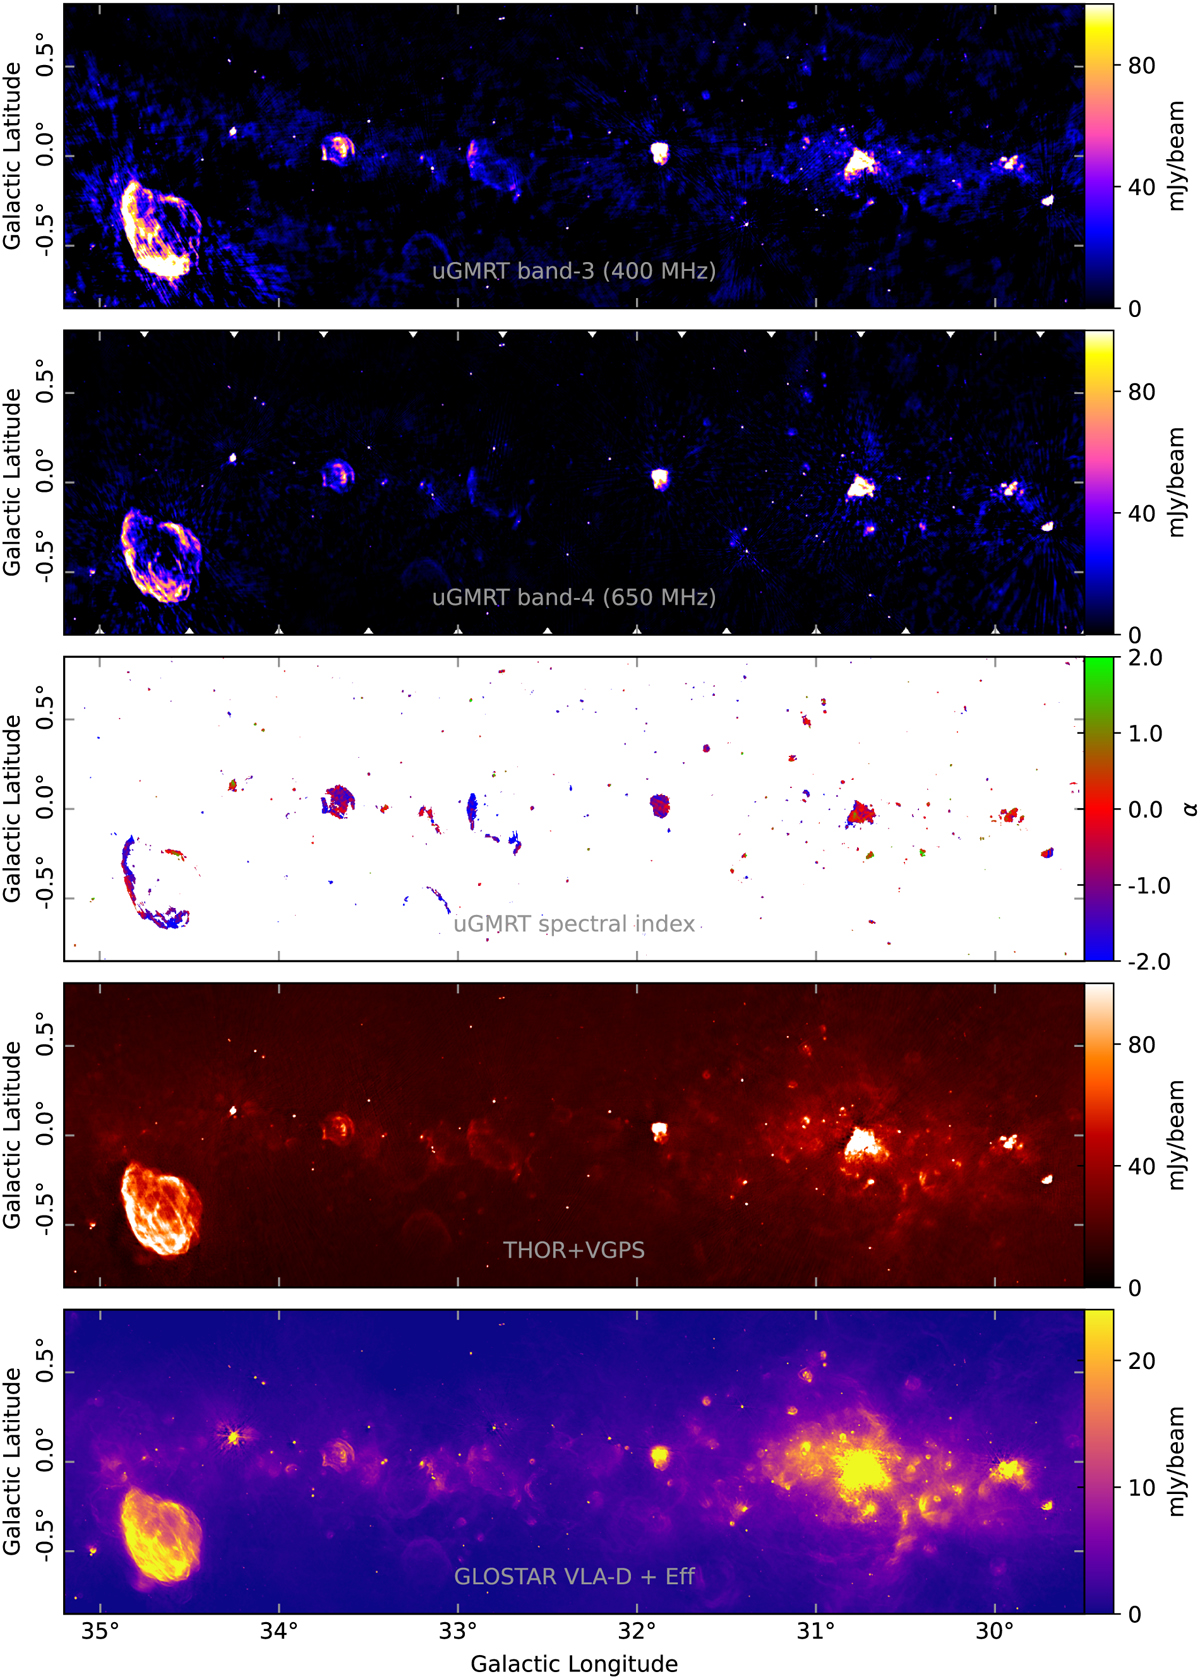
Radio images of the W43/W44 region. From top to bottom: band-3 and band-4 mosaics from this project convolved to the common beam size of 25″, their resulting spectral index map, the 1.4 GHz THOR image of the same area combined with the VGPS data (Beuther et al. 2016; Stil et al. 2006), which is also at 25″ resolution, and the 5.8 GHz GLOSTAR data (VLA D-configuration image combined with the Effelsberg image), which is at a resolution of 18″.
Current usage metrics show cumulative count of Article Views (full-text article views including HTML views, PDF and ePub downloads, according to the available data) and Abstracts Views on Vision4Press platform.
Data correspond to usage on the plateform after 2015. The current usage metrics is available 48-96 hours after online publication and is updated daily on week days.
Initial download of the metrics may take a while.