Open Access
Fig. 5
Download original image
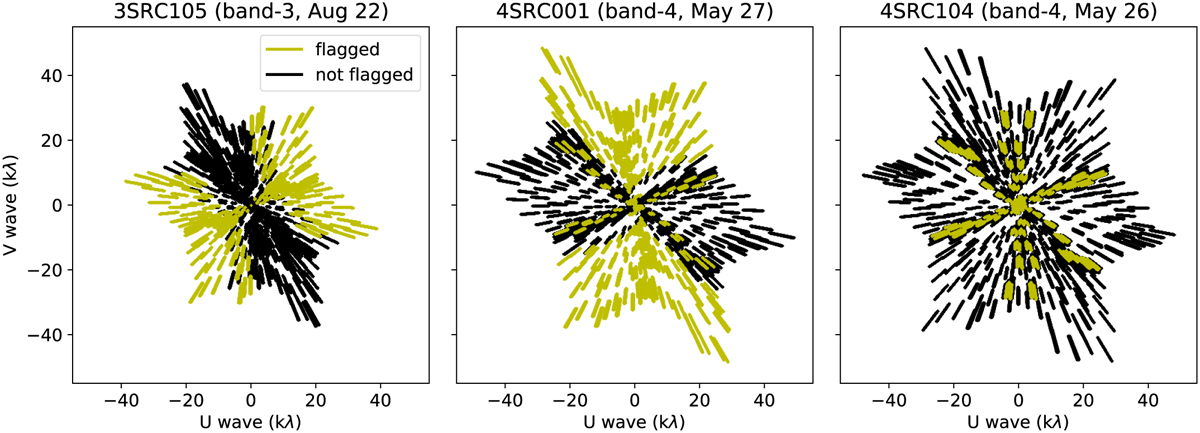
uv-coverage plots of typical fields observed on 2019 August 22 (left, 3SRC105), May 27 (middle, 4SRC001), and May 26 (right, 4SRC104). The asymmetry caused by non-functional antennas (marked in yellow) is clearly visible in the fields observed on August 22 and May 27, which leads to an elongation of the synthesized beam.
Current usage metrics show cumulative count of Article Views (full-text article views including HTML views, PDF and ePub downloads, according to the available data) and Abstracts Views on Vision4Press platform.
Data correspond to usage on the plateform after 2015. The current usage metrics is available 48-96 hours after online publication and is updated daily on week days.
Initial download of the metrics may take a while.