Fig. 2.
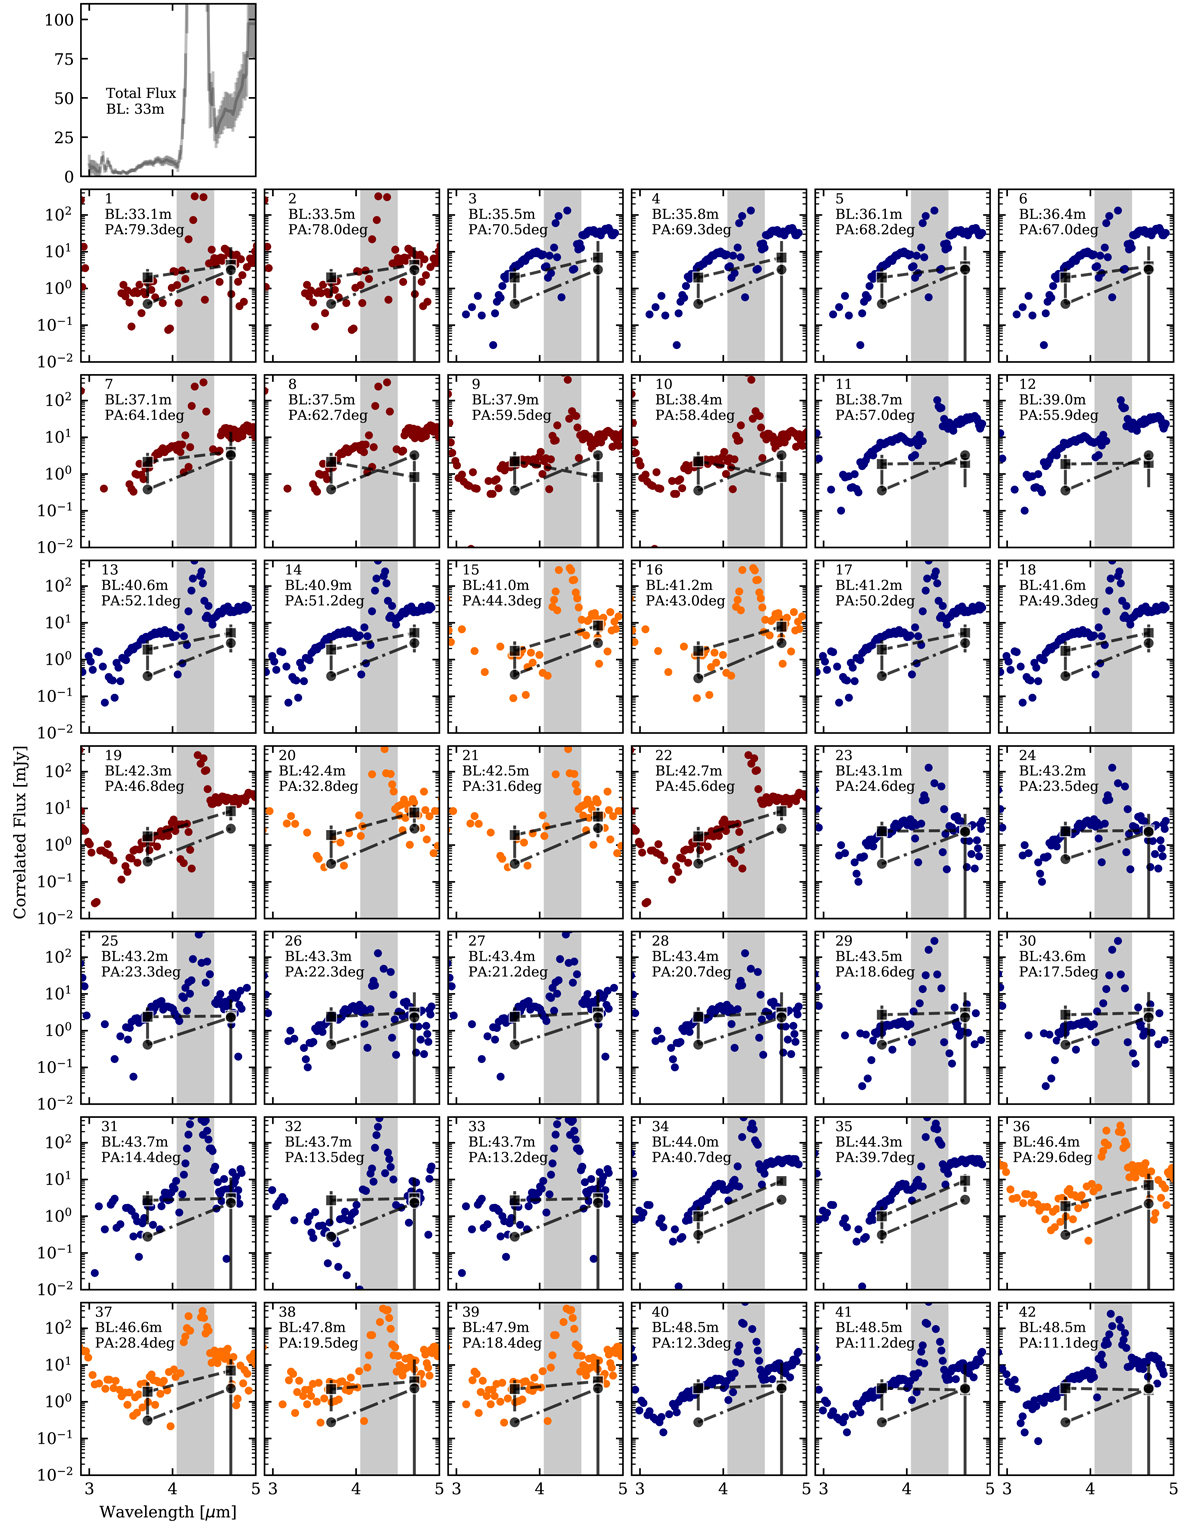
Download original image
Excerpt sample of calibrated correlated fluxes for Circinus in the LM band. The top-left panel shows the 33 m “total flux” used to compute squared visibilities. The colors indicate the observing date: March 2020 (blue), February 2021 (yellow), and May 2021 (red). Black squares and black circles are the predicted correlated fluxes from the image reconstructions and Gaussian model fits, respectively. Continued in Fig. B.1.
Current usage metrics show cumulative count of Article Views (full-text article views including HTML views, PDF and ePub downloads, according to the available data) and Abstracts Views on Vision4Press platform.
Data correspond to usage on the plateform after 2015. The current usage metrics is available 48-96 hours after online publication and is updated daily on week days.
Initial download of the metrics may take a while.