Fig. 9
Download original image
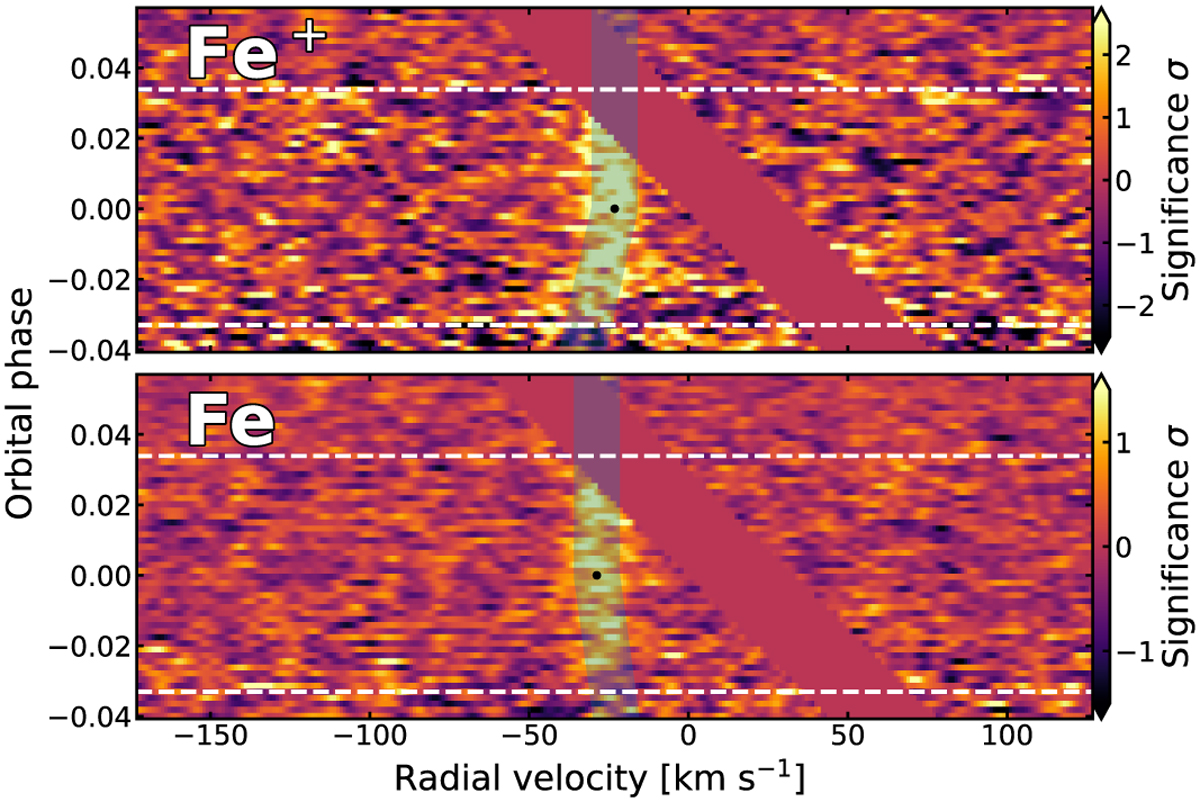
Two-dimensional cross-correlation function of Fe+ for all eight transit time series combined. The cross-correlation function is shifted to the projected orbital velocity found for the second part of the transit, υorb,2 to illustrate the earlier change of orbital velocity. We purposely limited the colour bar in order to enhance the absorption feature that helps make the misfit visible. The dot indicates the centre of the transit. The blue shaded region shows the best-fit result.
Current usage metrics show cumulative count of Article Views (full-text article views including HTML views, PDF and ePub downloads, according to the available data) and Abstracts Views on Vision4Press platform.
Data correspond to usage on the plateform after 2015. The current usage metrics is available 48-96 hours after online publication and is updated daily on week days.
Initial download of the metrics may take a while.