Fig. 7
Download original image
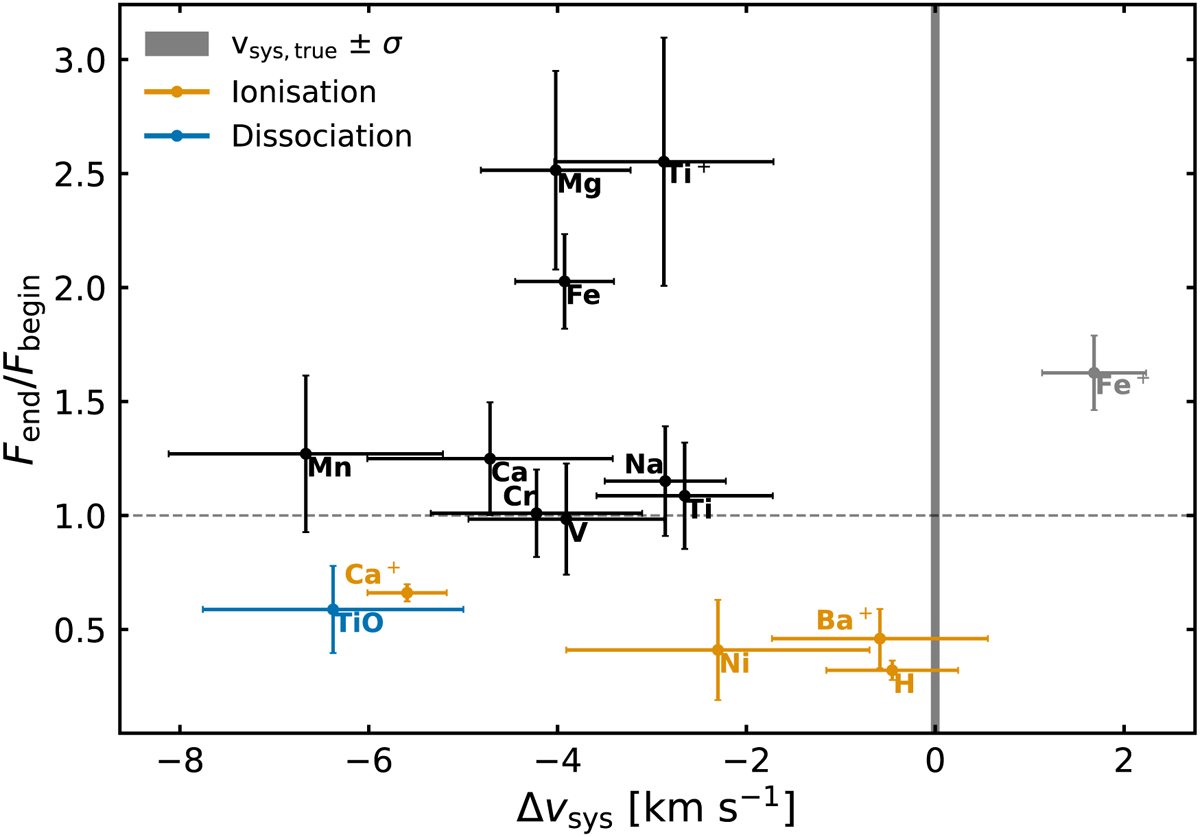
Change in signal strength between the start and the end of the transit as a function of the observed deviation from the expected systemic velocity. The error bars denote 1σ uncertainties calculated via Gaussian error propagation. The grey vertical region indicates range (−24.452 ± 0.012km s−1). We note that Sr and Sr+ are not included in this figure due to large uncertainties. We also note that Fe+ is an outlier (see Fig. 9). The hotter atmosphere rotating into view (see Fig. 1) causes most signal strengths to increase over the course of transit. However, further ionisation (Ca+, Ni, Ba+, and H) or dissociation (TiO) on the dayside can also cause some signals to decrease over time.
Current usage metrics show cumulative count of Article Views (full-text article views including HTML views, PDF and ePub downloads, according to the available data) and Abstracts Views on Vision4Press platform.
Data correspond to usage on the plateform after 2015. The current usage metrics is available 48-96 hours after online publication and is updated daily on week days.
Initial download of the metrics may take a while.