Fig. 5
Download original image
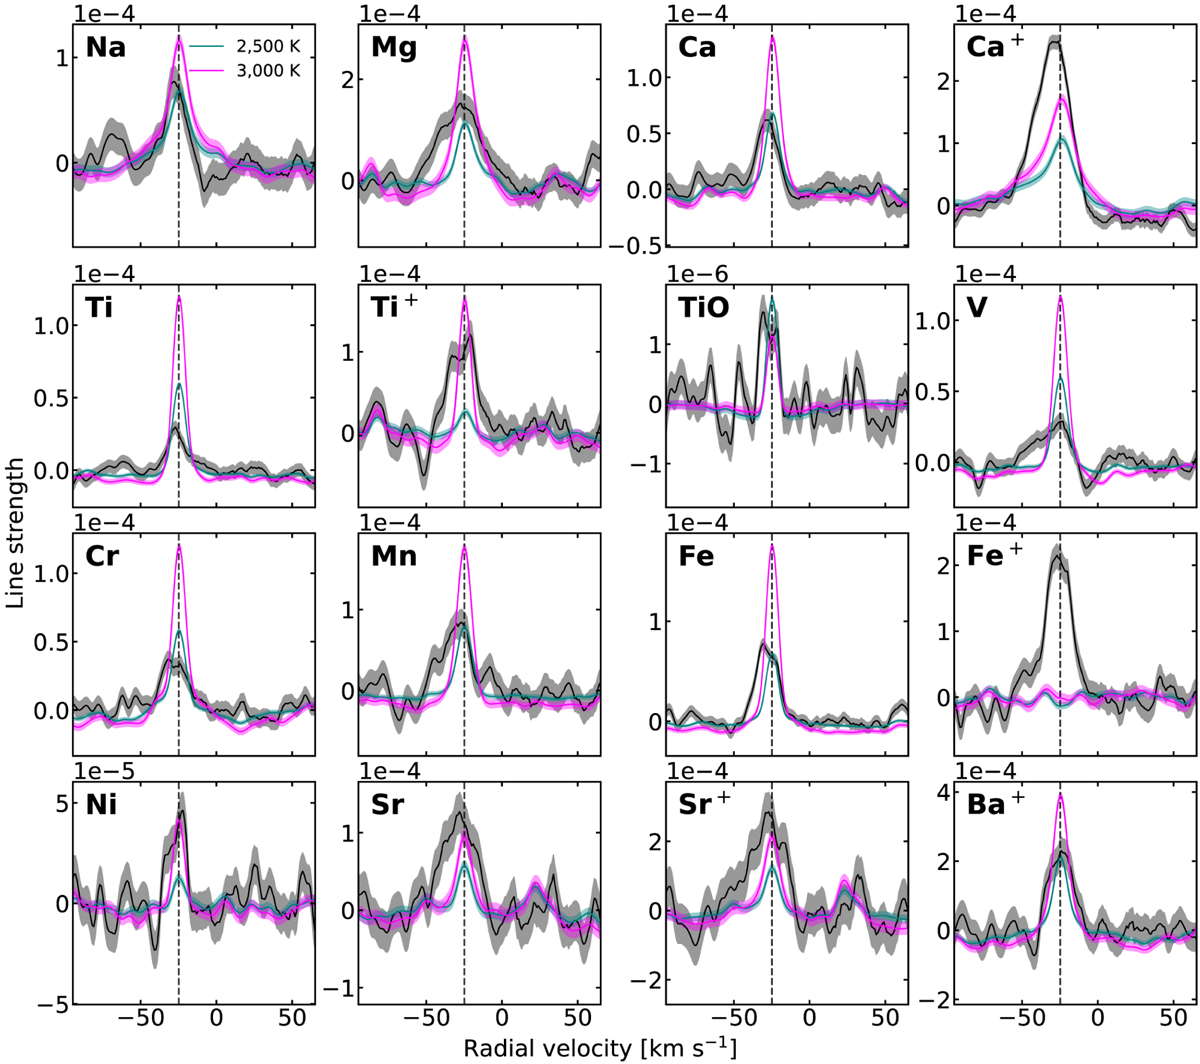
One-dimensional cross-correlation results extracted at the projected best-fit orbital velocity compared to the injected signal at Kp = 200.7 ± 4.9 km s−1. The model predictions show the expected signal strength using models at 2500 (in teal) and 3000 K (in magenta) in chemical and hydrostatic equilibrium of solar metallicity, previously used in Prinoth et al. (2022). The shaded regions indicate the standard deviation away from the peak. Neutral atoms are generally well described by the model at 2500 K. The dashed vertical line shows the expected systemic velocity of −24.452 ± 0.012km s−1. The model prediction of TiO has been scaled by a factor of six to match the predicted signal strength in Prinoth et al. (2022) for the purpose of comparing the datasets from the instruments in Fig. 6.
Current usage metrics show cumulative count of Article Views (full-text article views including HTML views, PDF and ePub downloads, according to the available data) and Abstracts Views on Vision4Press platform.
Data correspond to usage on the plateform after 2015. The current usage metrics is available 48-96 hours after online publication and is updated daily on week days.
Initial download of the metrics may take a while.