Open Access
Fig. C.2
Download original image
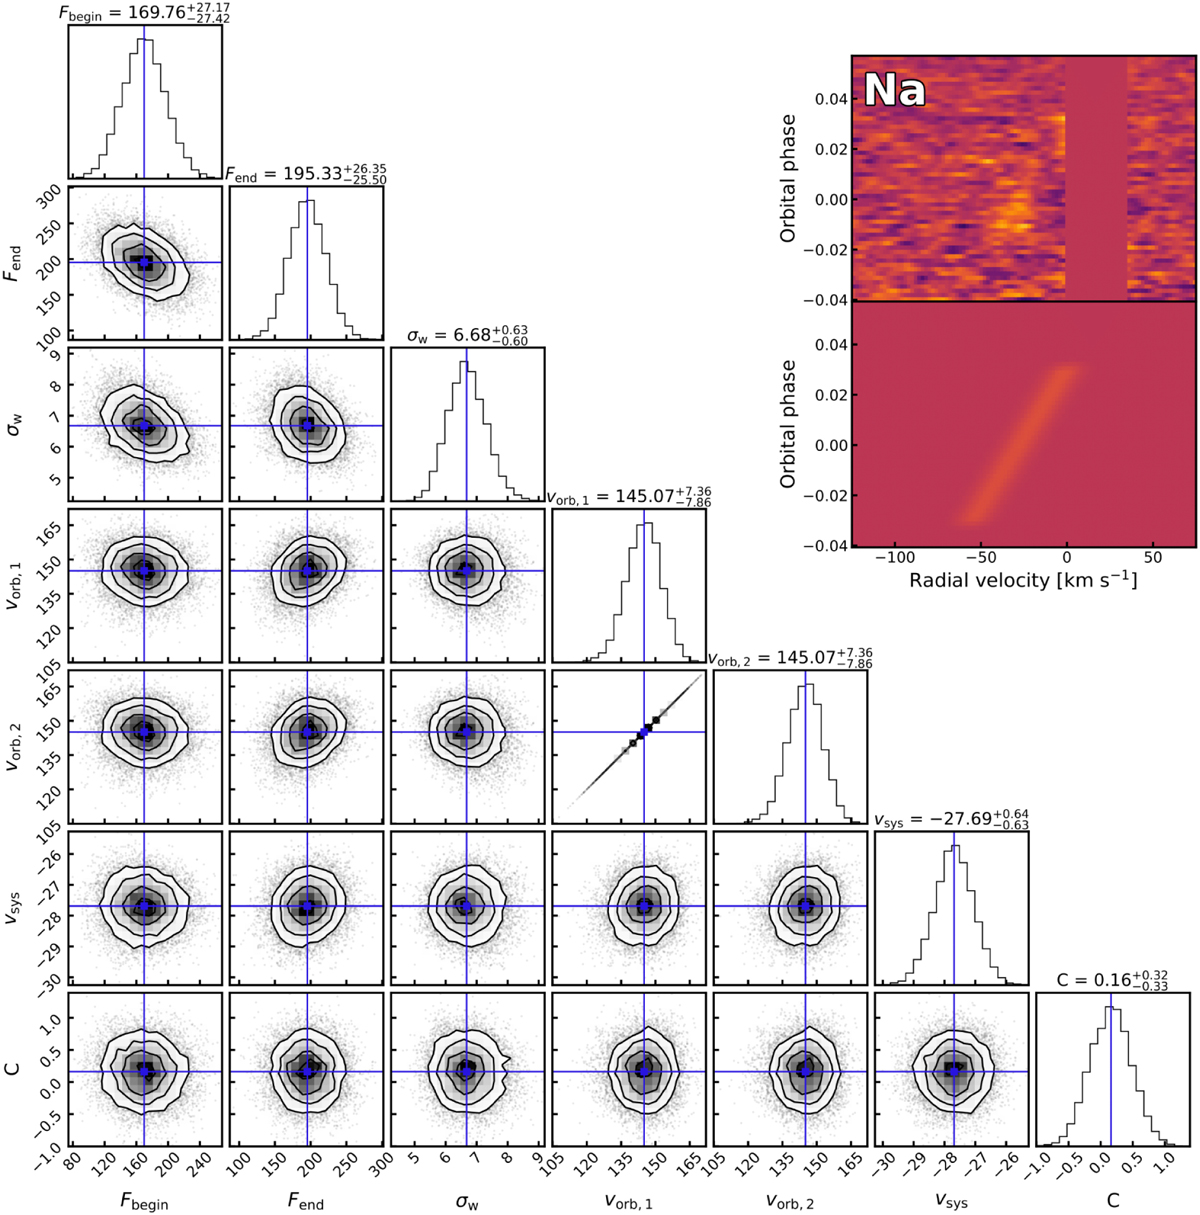
Same as Fig. C.1 but for Na. We note that for Na, the projected orbital velocity was forced to be equal for both regions of the transit, as the posterior distribution reached the bounds of feasible priors. To avoid correlations, we opted for fitting only one orbital velocity instead of two.
Current usage metrics show cumulative count of Article Views (full-text article views including HTML views, PDF and ePub downloads, according to the available data) and Abstracts Views on Vision4Press platform.
Data correspond to usage on the plateform after 2015. The current usage metrics is available 48-96 hours after online publication and is updated daily on week days.
Initial download of the metrics may take a while.