Fig. 1
Download original image
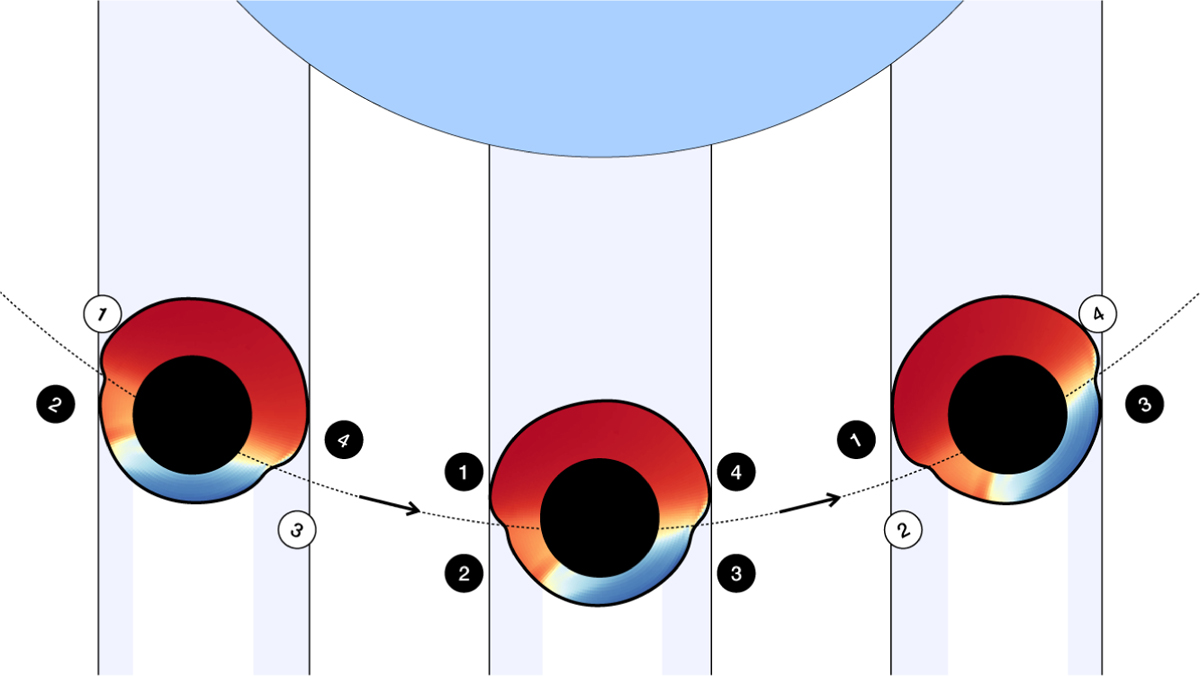
Schematic of the contribution of different regions of the planetary atmosphere to the observed absorption signal over the course of the transit from left to right. As the planet rotates over the course of the transit, different regions become observable and dominate the contributions. Generally, the leading terminator (3, 4) is colder than the trailing terminator (1, 2). The atmosphere at the trailing terminator is therefore expected to be more inflated (puffy) and generally more susceptible to transmission spectroscopy. The terminator regions that dominate the observed absorption signal are denoted with black circles. The colouring of the atmosphere is taken from Lee et al. (2022) to reflect the temperature of the atmosphere at a pressure of 1 mbar. The shape of the atmosphere with an increased radius on the dayside is adopted from Wardenier et al. (2021). We note that the schematic is not to scale. The changing viewing angle from the start to the centre of the transit for WASP-189 b is α = arcsin ![]() , where b is the impact parameter (
, where b is the impact parameter (![]() , Deline et al. 2022), R, is the stellar radius, and a is the semi-major axis.
, Deline et al. 2022), R, is the stellar radius, and a is the semi-major axis.
Current usage metrics show cumulative count of Article Views (full-text article views including HTML views, PDF and ePub downloads, according to the available data) and Abstracts Views on Vision4Press platform.
Data correspond to usage on the plateform after 2015. The current usage metrics is available 48-96 hours after online publication and is updated daily on week days.
Initial download of the metrics may take a while.