Fig. 2.
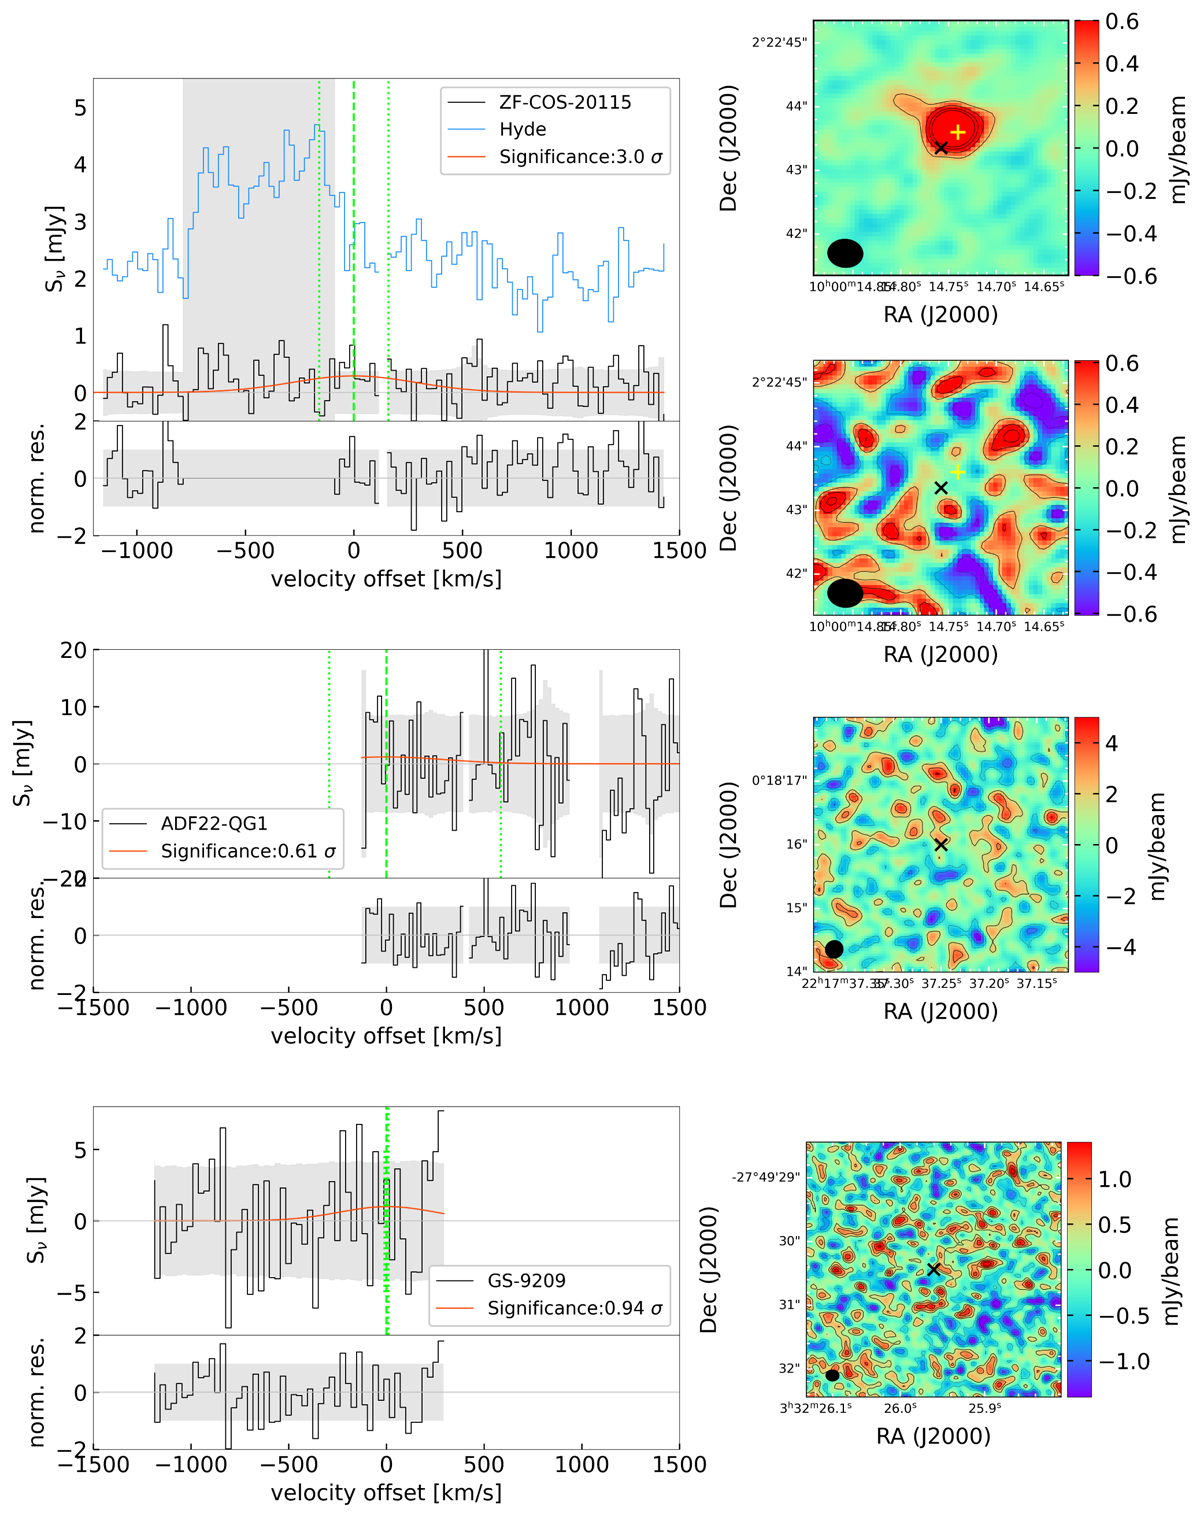
Download original image
[CII] coverage for our sources. Left column: spectra extracted at the position of our targets. The dashed and dotted green lines are, respectively, the expected νobs, [CII] and its uncertainty. The red curves show the MPFIT Gaussian fits at fixed frequency and FWHM. Channels where a significant contribution from Hyde could be expected were masked, as shown by the grey vertical area. Right column: dirty images averaged over the stellar FWHM of our sources: ZF-COS-20115, before and after Hyde’s subtraction (top two panels); ADF22-QG1 (mid panel); GS-9209 (bottom panel). The positions of the QGs are shown as black crosses. The contours show 1, 2, 3, and 4 times the rms of the image.
Current usage metrics show cumulative count of Article Views (full-text article views including HTML views, PDF and ePub downloads, according to the available data) and Abstracts Views on Vision4Press platform.
Data correspond to usage on the plateform after 2015. The current usage metrics is available 48-96 hours after online publication and is updated daily on week days.
Initial download of the metrics may take a while.