Fig. 1.
Download original image
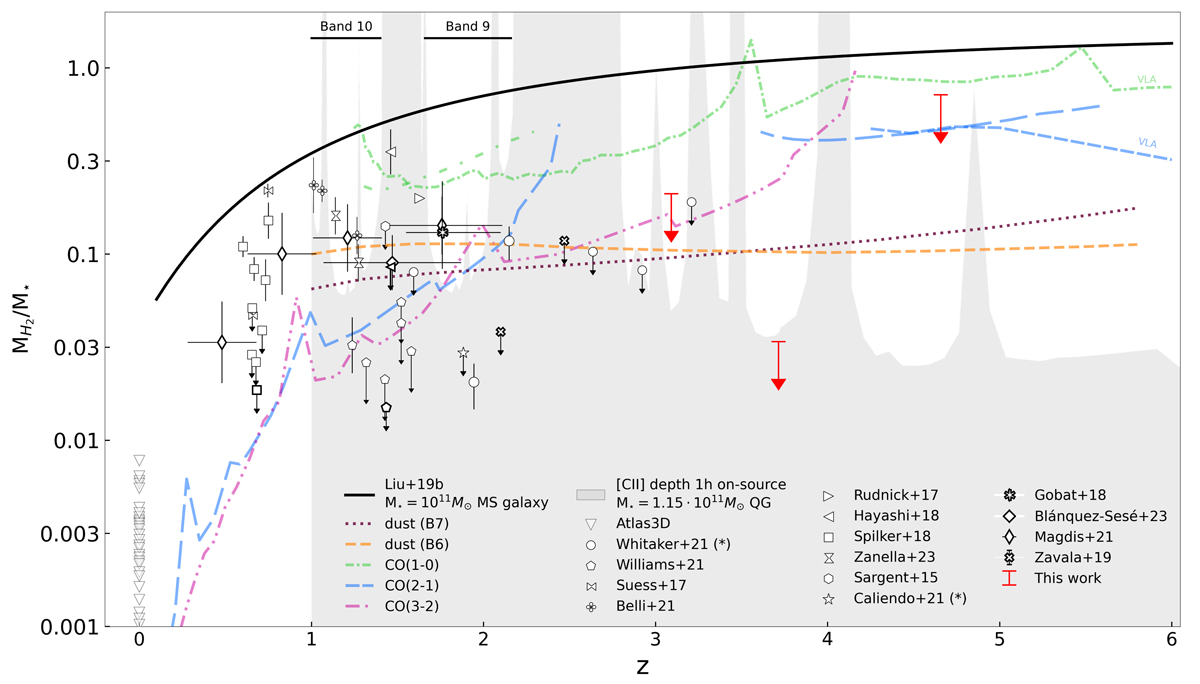
Depths (3σ) of different gas mass tracers with redshift with 1 h of on-source time for an M⋆ = 1.2 × 10¹¹ M⊙ galaxy (including ALMA Bands 1 and 2 or VLA; see Sect. 2). For clarity, the depth reached by the [CII] line is highlighted by the grey shaded region, i.e. higher fmol are expected as detections in the white area above it. The black solid line shows the gas fraction evolution for a main sequence galaxy with M⋆ = 1011 M⊙ from Liu et al. (2019). The QGs from the literature are shown as white markers. Measurements from stacked samples are shown with thick black contours. The gas fraction values were converted to a Chabrier IMF wherever necessary. All CO measurements were homogenised to αCO = 4.4 M⊙ (K km s−1 pc2)−1. All dust measurements were homogenised to a G/D ratio of 92. (*) The original measurements from Whitaker et al. (2021a) have been corrected according to the stellar profile-based extraction in Gobat et al. (2022) and by using the dust template by Magdis et al. (2021).
Current usage metrics show cumulative count of Article Views (full-text article views including HTML views, PDF and ePub downloads, according to the available data) and Abstracts Views on Vision4Press platform.
Data correspond to usage on the plateform after 2015. The current usage metrics is available 48-96 hours after online publication and is updated daily on week days.
Initial download of the metrics may take a while.