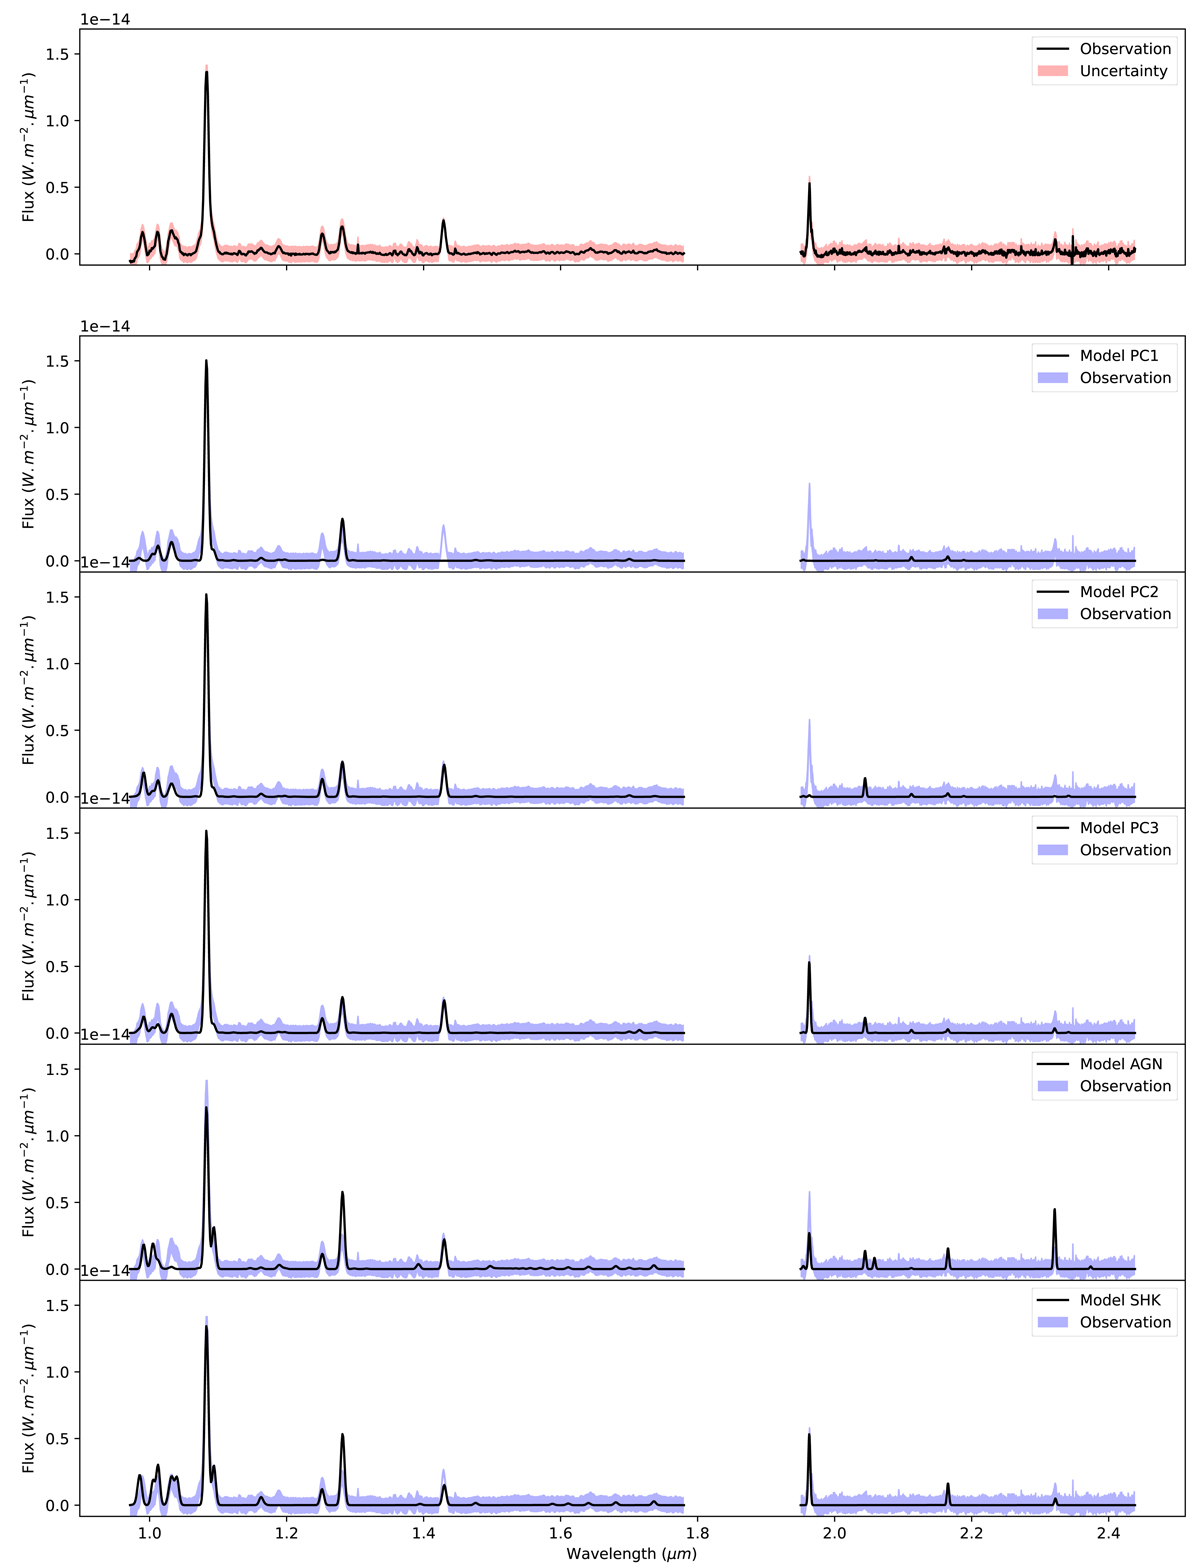
Fig. A.2.
Download original image
Cloud C: Comparison between the observed spectrum and the various models. The top panel shows the observed spectrum in black with the estimated uncertainty overlaid in transparent red. The five following plots show the prediction from models PC1, PC2, PC3, AGN, and SHK, in that order, with the observation overlaid in transparent blue.
Current usage metrics show cumulative count of Article Views (full-text article views including HTML views, PDF and ePub downloads, according to the available data) and Abstracts Views on Vision4Press platform.
Data correspond to usage on the plateform after 2015. The current usage metrics is available 48-96 hours after online publication and is updated daily on week days.
Initial download of the metrics may take a while.