Open Access
Fig. 3.
Download original image
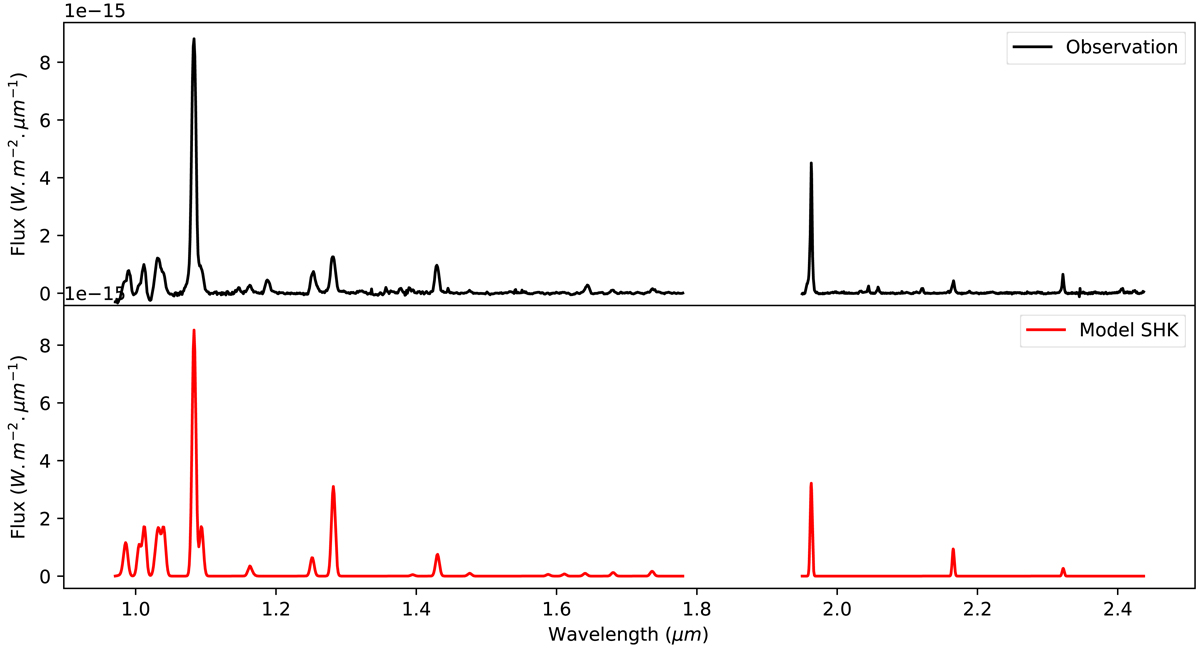
Cloud D: comparison between the observed spectrum (top, black) and the best model (bottom, red). The numerical values of the fluxes from the model’s main emission lines are compared with those from the observation in Table E.3 from the appendix.
Current usage metrics show cumulative count of Article Views (full-text article views including HTML views, PDF and ePub downloads, according to the available data) and Abstracts Views on Vision4Press platform.
Data correspond to usage on the plateform after 2015. The current usage metrics is available 48-96 hours after online publication and is updated daily on week days.
Initial download of the metrics may take a while.