Fig. 2.
Download original image
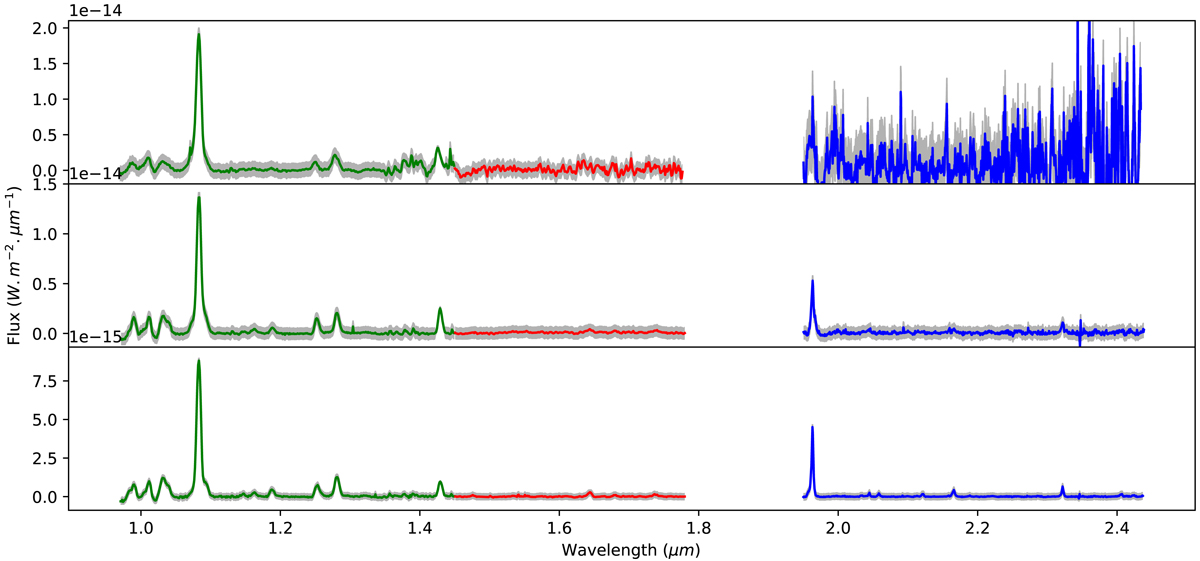
Combined YJHK spectra of the clouds with increasing distance from the nucleus. From top to bottom, the panels show a distance of 0.0″ (B/S1/nucleus), 0.25″ (C), and 0.7″ (D). The SPHERE data are displayed in green, the SINFONI data in blue, and the averaged overlap in red. The estimated uncertainty is indicated as a gray area.
Current usage metrics show cumulative count of Article Views (full-text article views including HTML views, PDF and ePub downloads, according to the available data) and Abstracts Views on Vision4Press platform.
Data correspond to usage on the plateform after 2015. The current usage metrics is available 48-96 hours after online publication and is updated daily on week days.
Initial download of the metrics may take a while.