Fig. 9
Download original image
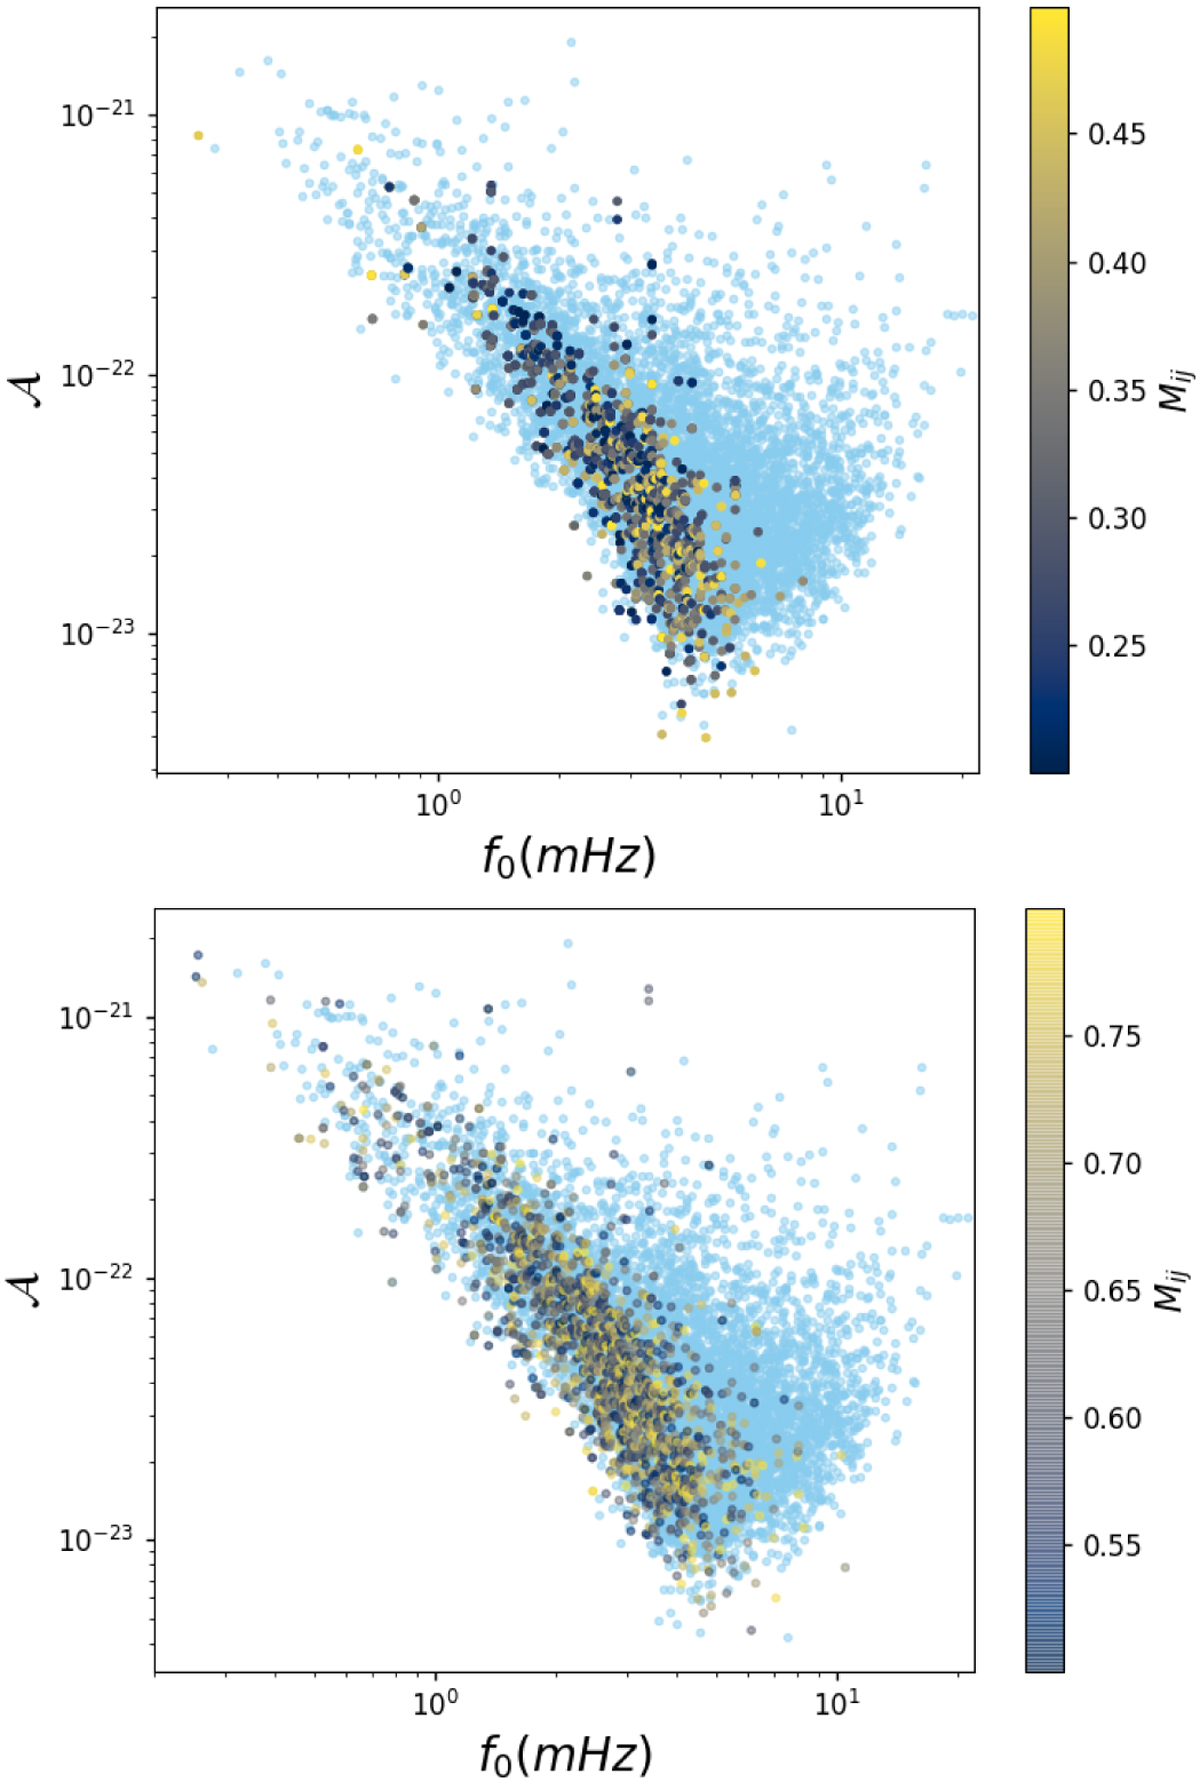
Correlation value for confused 12-month catalogue UCBs. In the top graph, the colour-bar shows the correlation value for 12-month catalogue UCBs that are confused with Mij < 0.5. In the bottom graph, the colour-bar shows the correlation value for 12-month catalogue UCBs that are confused with 0.5 < Mij < 0.8. In both graphs, these are plotted over all of the Mij > 0.8, matching, 12-month catalogue UCBs (light blue).
Current usage metrics show cumulative count of Article Views (full-text article views including HTML views, PDF and ePub downloads, according to the available data) and Abstracts Views on Vision4Press platform.
Data correspond to usage on the plateform after 2015. The current usage metrics is available 48-96 hours after online publication and is updated daily on week days.
Initial download of the metrics may take a while.