Open Access
Fig. A.3
Download original image
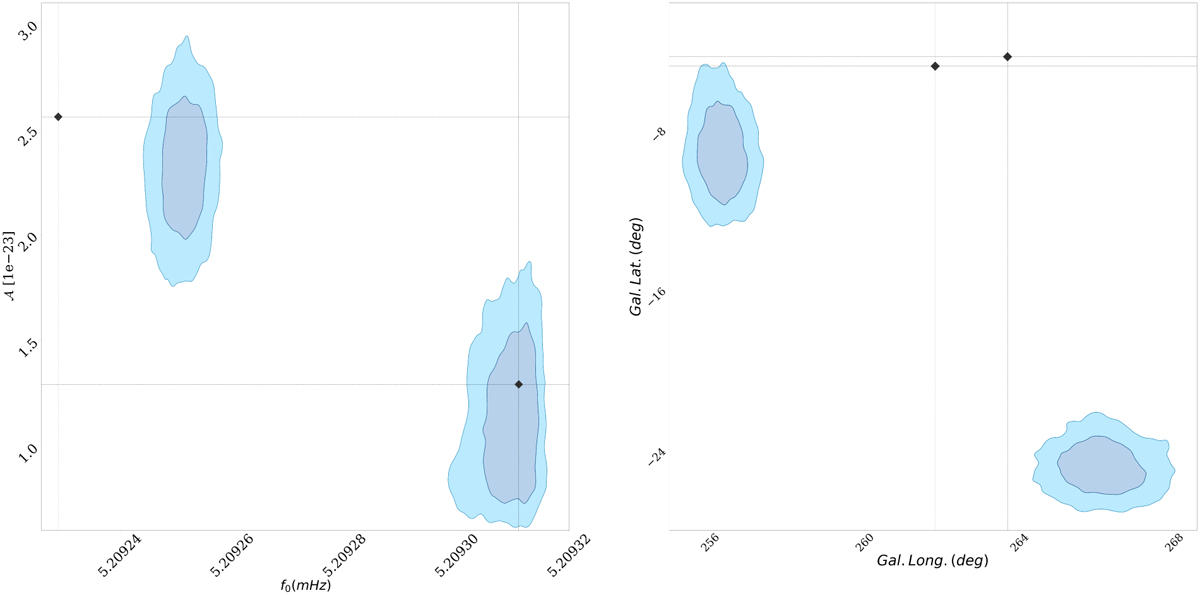
Corner case 2: The 1 and 2σ posteriors for the f0-A and sky location for two non-matching catalogue UCBs, for the 24-month analysis. The injected signal values are the black markers.
Current usage metrics show cumulative count of Article Views (full-text article views including HTML views, PDF and ePub downloads, according to the available data) and Abstracts Views on Vision4Press platform.
Data correspond to usage on the plateform after 2015. The current usage metrics is available 48-96 hours after online publication and is updated daily on week days.
Initial download of the metrics may take a while.