Fig. 10
Download original image
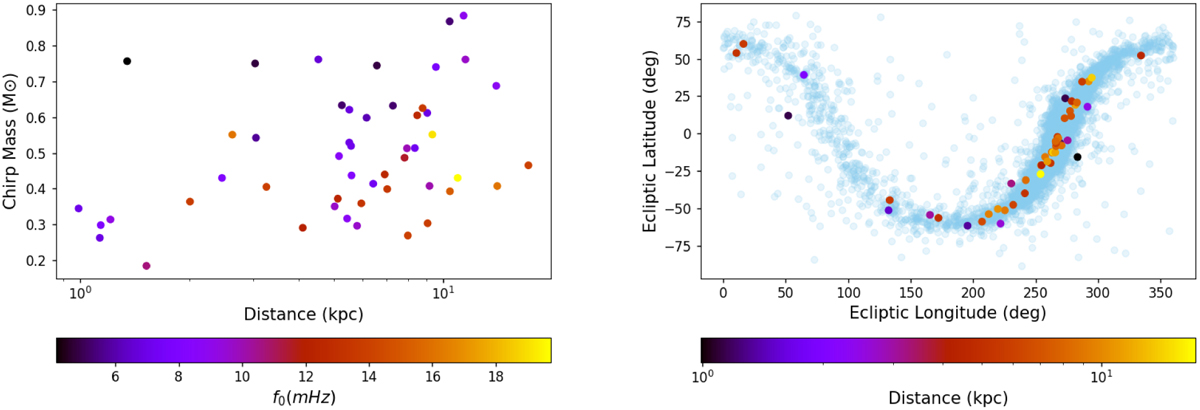
Chirp mass versus distance for eclipsing and well-localised catalogue UCB that are matched. The graph on the left shows chirp mass versus distance for all matched 12-month catalogue UCBs that are eclipsing and have positive ![]() , coloured by GW frequency. Eclipsing UCB are defined here as having more than 90% of their inclination angle samples constrained within 70° < ι(deg.) < 110°. The graph on the right shows the ecliptic coordinates of the UCB from the left graph, now coloured by distance. These are plotted over all 12-month catalogue UCB that have Mij > 0.8 (light blue).
, coloured by GW frequency. Eclipsing UCB are defined here as having more than 90% of their inclination angle samples constrained within 70° < ι(deg.) < 110°. The graph on the right shows the ecliptic coordinates of the UCB from the left graph, now coloured by distance. These are plotted over all 12-month catalogue UCB that have Mij > 0.8 (light blue).
Current usage metrics show cumulative count of Article Views (full-text article views including HTML views, PDF and ePub downloads, according to the available data) and Abstracts Views on Vision4Press platform.
Data correspond to usage on the plateform after 2015. The current usage metrics is available 48-96 hours after online publication and is updated daily on week days.
Initial download of the metrics may take a while.