Fig. 7
Download original image
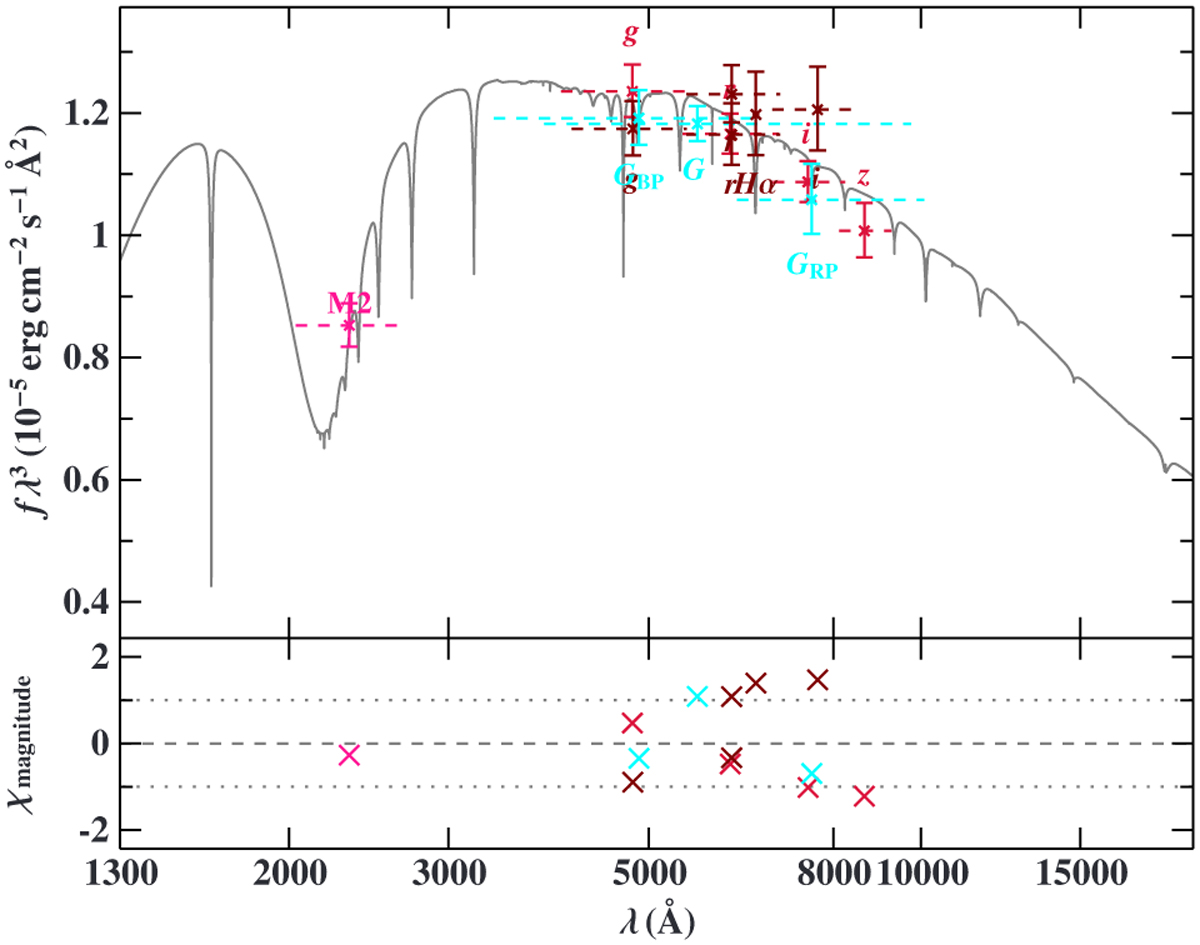
SED fit for WD1. Filter-averaged fluxes converted from observed magnitudes are shown in different colors (Gaia in cyan, IGAPS in dark red, Pan-STARRS in red, and XMM-OM in magenta). The respective full widths at tenth maximum are shown as dashed horizontal lines. A pure He model with Teff = 90 000 K and log ɡ = 8.3 that was interpolated from the grid computed in Reindl et al. (2023) and degraded to a spectral resolution of 6 Å is plotted in gray. To reduce the steep SED slope, the flux has been multiplied by the wavelength cubed. Bottom panel: Difference between synthetic and observed magnitudes.
Current usage metrics show cumulative count of Article Views (full-text article views including HTML views, PDF and ePub downloads, according to the available data) and Abstracts Views on Vision4Press platform.
Data correspond to usage on the plateform after 2015. The current usage metrics is available 48-96 hours after online publication and is updated daily on week days.
Initial download of the metrics may take a while.