Open Access
Fig. 5
Download original image
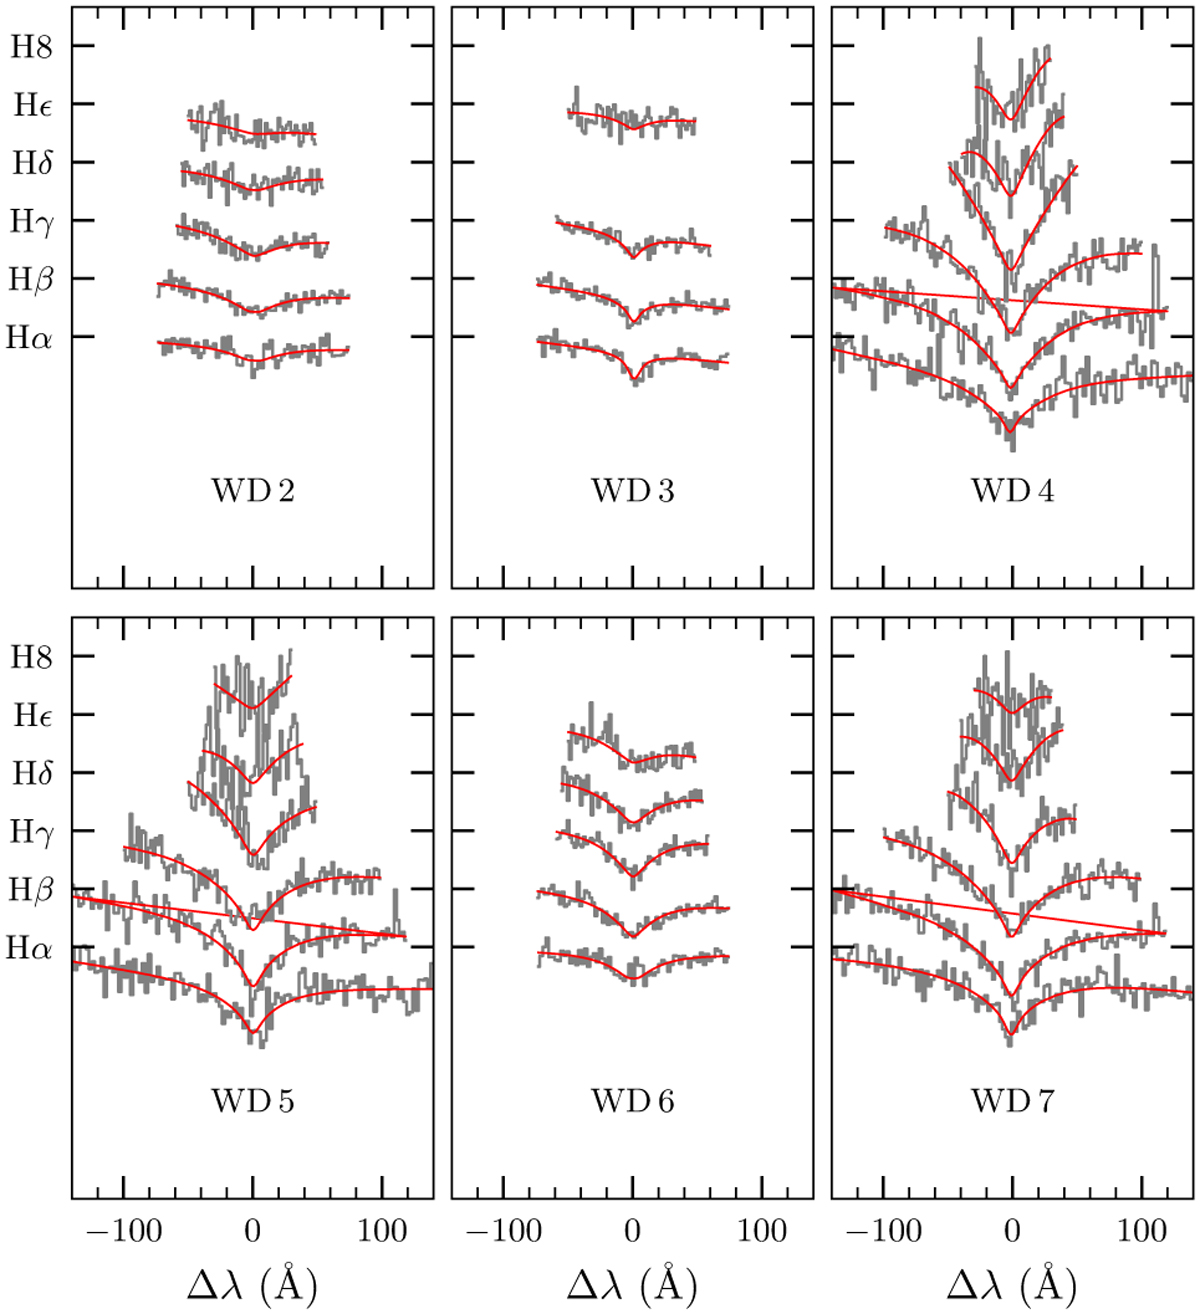
Best-fit results of the spectral analysis for the six DA white dwarfs. The observed Balmer lines and the best-fit models are shown in gray and red, respectively. The respective values for Teff and log ɡ are given in Table 3.
Current usage metrics show cumulative count of Article Views (full-text article views including HTML views, PDF and ePub downloads, according to the available data) and Abstracts Views on Vision4Press platform.
Data correspond to usage on the plateform after 2015. The current usage metrics is available 48-96 hours after online publication and is updated daily on week days.
Initial download of the metrics may take a while.