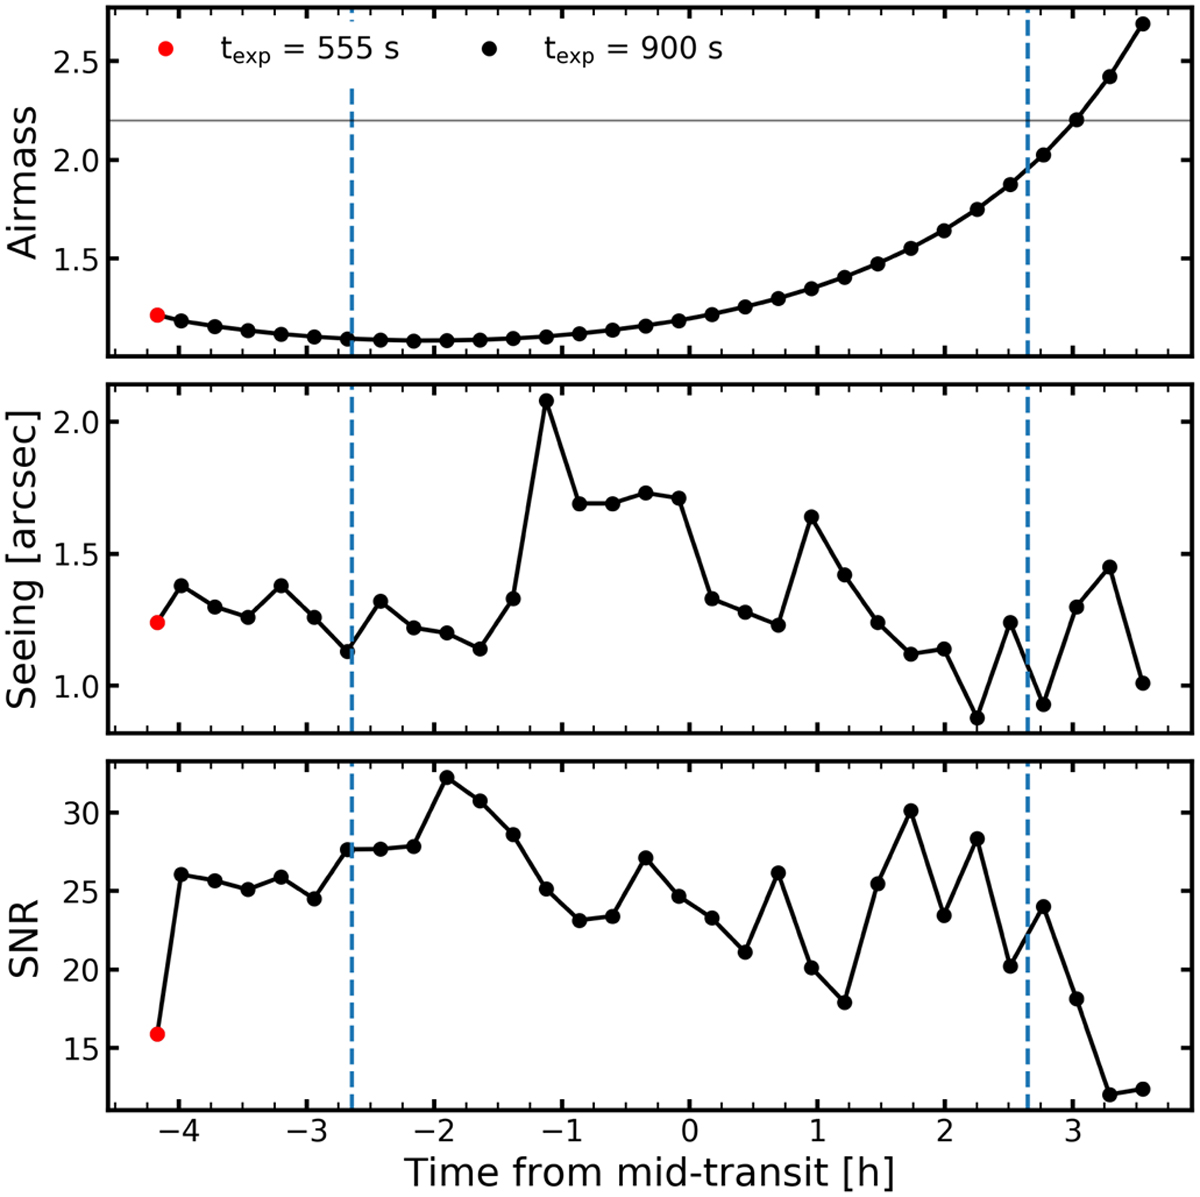
Fig. 2
Download original image
Log of observations. Airmass (upper), seeing (middle), and signal-to-noise ratio in order 56 (bottom) during the time series. The vertical dashed blue lines indicate the start and the end of the transit. The first exposure has a shorter exposure time of 555 s. The grey horizontal line indicates the 2.2 airmass calibration limit of the ADC, based on which the three last exposures were rejected.
Current usage metrics show cumulative count of Article Views (full-text article views including HTML views, PDF and ePub downloads, according to the available data) and Abstracts Views on Vision4Press platform.
Data correspond to usage on the plateform after 2015. The current usage metrics is available 48-96 hours after online publication and is updated daily on week days.
Initial download of the metrics may take a while.