Open Access
Fig. 9.
Download original image
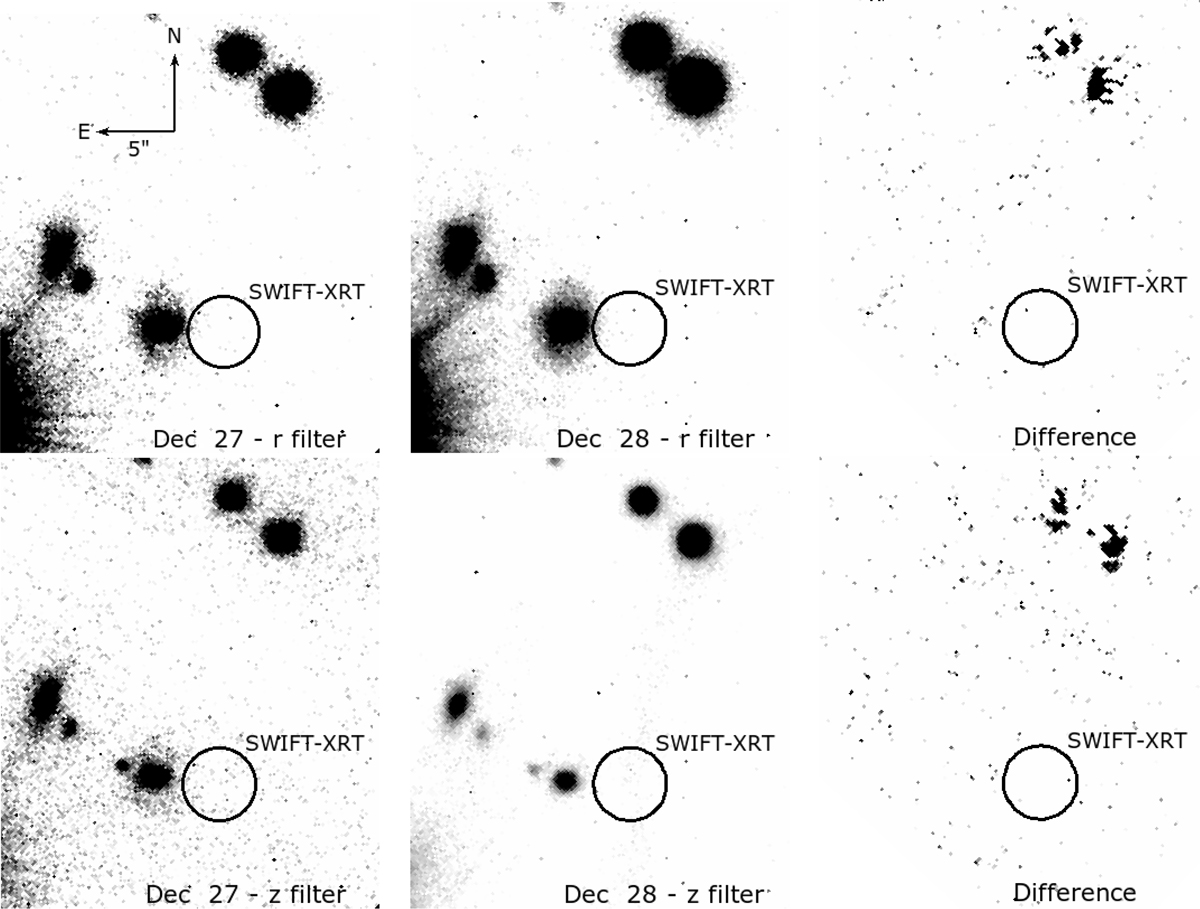
X-shooter images of the field of GRB 211227A. Top panels: r-band images of the two epochs (Dec. 27 and Dec. 28) along with their subtraction. The circle represents the XRT 90% error region. Bottom panels: same as above for the z-band observations.
Current usage metrics show cumulative count of Article Views (full-text article views including HTML views, PDF and ePub downloads, according to the available data) and Abstracts Views on Vision4Press platform.
Data correspond to usage on the plateform after 2015. The current usage metrics is available 48-96 hours after online publication and is updated daily on week days.
Initial download of the metrics may take a while.