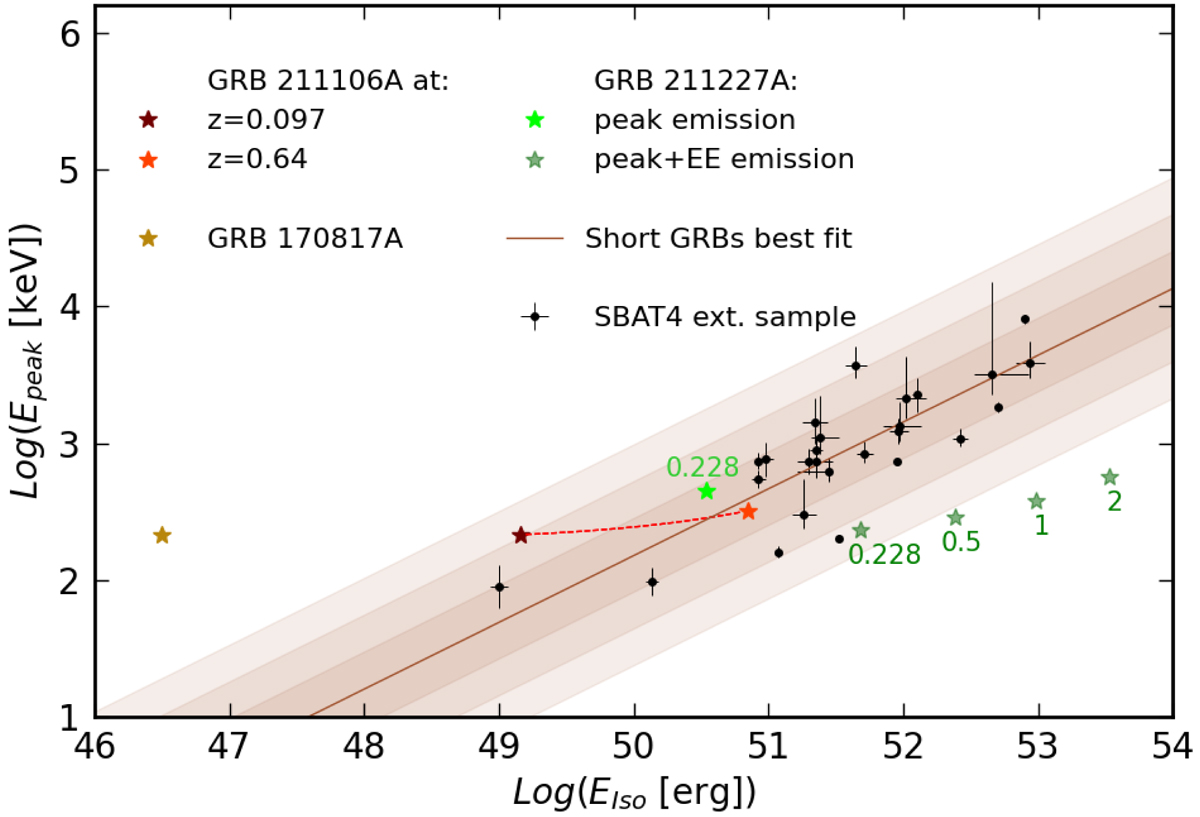
Fig. 23.
Download original image
Amati relation for the S-BAT4 extended sample. SGRBs are represented by black dots, shaded regions represent the 1, 2, and 3σ scatter of the sample around the best fit. GRB 211106A becomes more consistent with the best fit at increasing values of redshift. GRB 211227A is in agreement for both the main and the whole emission with the correlation for the redshift of z = 0.228. As a reference we reported also the prompt energy features for z = 0.5, 1, and 2 for the whole emission phase.
Current usage metrics show cumulative count of Article Views (full-text article views including HTML views, PDF and ePub downloads, according to the available data) and Abstracts Views on Vision4Press platform.
Data correspond to usage on the plateform after 2015. The current usage metrics is available 48-96 hours after online publication and is updated daily on week days.
Initial download of the metrics may take a while.