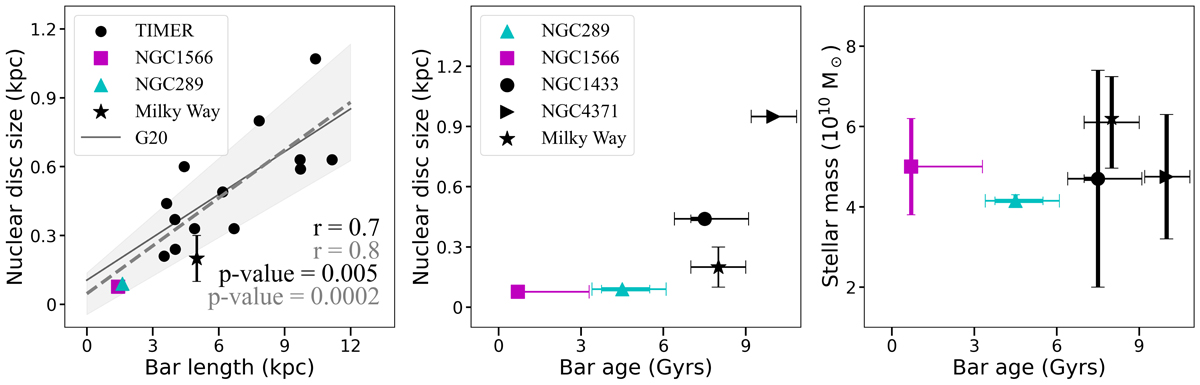
Fig. 5.
Download original image
Smallest nuclear disc and their young bars in context. Left: relation of the nuclear disc size with bar length from the TIMER sample (Gadotti et al. 2020, black circles), together with the two galaxies from this paper: NGC 289 (cyan triangle) and NGC 1566 (magenta square), as well as values for the Milky Way (black star). For the nuclear disc size for the Milky Way, we consider ∼100 − 300 pc (Sormani et al. 2020, 2022) and for the bar length, 5.0 ± 0.2 kpc (Wegg et al. 2015). We also display the linear regression for the TIMER sample alone (solid black line) and considering this work, with the two new galaxies (dashed grey line). With the galaxies in this work, the Pearson correlation coefficient between nuclear disc size and bar length is strengthened from 0.73 (TIMER only) to 0.82 (this work). We do not consider the Milky Way for linear regression. The two galaxies from this work host considerably smaller nuclear discs than the ones in the TIMER sample. Centre: relation of nuclear disc size with bar age. We consider the values for NGC 1433 (de Sá-Freitas et al. 2023), NGC 4371 (Gadotti et al. 2015, 2020), the Milky Way (Sormani et al. 2020, 2022; Wylie et al. 2022; Sanders et al. 2022), and the two galaxies from this work, NGC 289 and NGC 1566. The error bars of NGC 289 and NGC 1566 are the statistical and systematic errors, measured in this work; for NGC 1433, we considered the statistical and systematic errors from de Sá-Freitas et al. (2023); for the Milky Way, we considered the different values from the literature, and for NGC 4371, we considered the measured errors from Gadotti et al. (2015). It is clear that the bar ages measured for NGC 289 and NGC 1566 are the youngest, even when considering the error bars. Right: values of the total stellar mass as a function of bar age. For stellar mass values, we consider the mean value of different literature references (see Table 1). We do not consider the extrapolated values for total stellar mass from this work. With the information from the five galaxies, we find no correlation. This could indicate that downsizing is not sufficient to determine bar formation, although more data is needed to achieve robust results.
Current usage metrics show cumulative count of Article Views (full-text article views including HTML views, PDF and ePub downloads, according to the available data) and Abstracts Views on Vision4Press platform.
Data correspond to usage on the plateform after 2015. The current usage metrics is available 48-96 hours after online publication and is updated daily on week days.
Initial download of the metrics may take a while.