Fig. 2.
Download original image
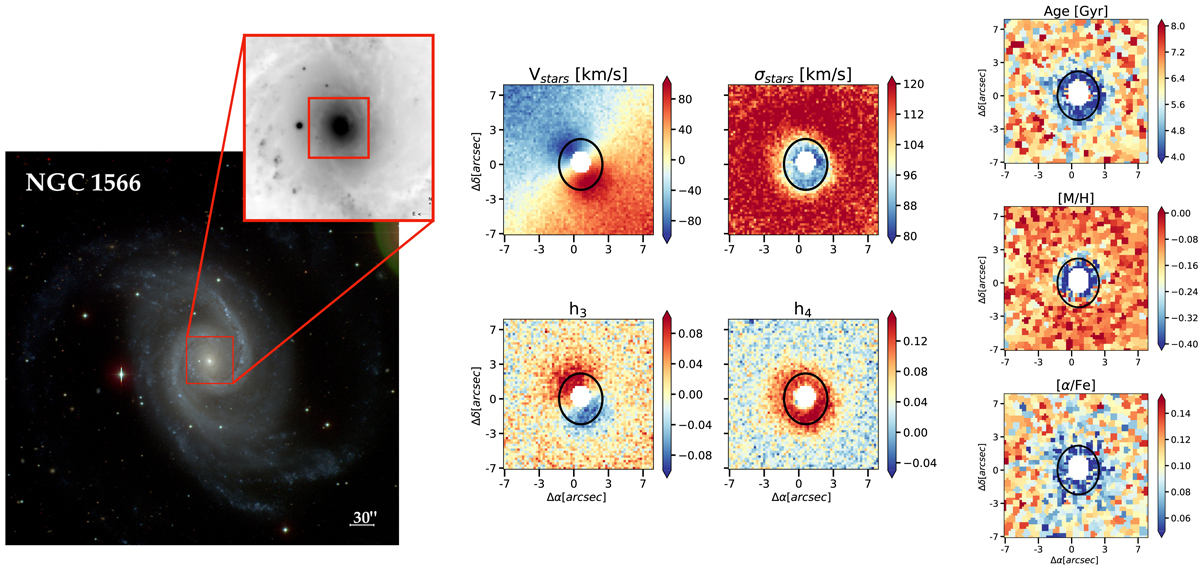
NGC 1566 data and derived maps. Details are the same as in Fig. 1. With the spatial maps, we display the limit of the nuclear disc measured considering the peak in the V/σ radial profile, in a black solid ellipse. We find a nuclear disc with a radius size of 77 pc. Within the limits of the ellipse, we can notice most of the properties expected for a nuclear disc: increase in stellar velocity, decrease in stellar velocity dispersion, anti-correlation between h3 and the stellar velocity, increase in h4, decrease in mean ages, and decrease in [α/Fe]. The only property that differs from expected is the [M/H], which also decreases. This behaviour can be related to the original properties of the in-falling gas. Lastly, we mask the central region which presented strong emission lines, characteristic of AGN.
Current usage metrics show cumulative count of Article Views (full-text article views including HTML views, PDF and ePub downloads, according to the available data) and Abstracts Views on Vision4Press platform.
Data correspond to usage on the plateform after 2015. The current usage metrics is available 48-96 hours after online publication and is updated daily on week days.
Initial download of the metrics may take a while.