Fig. 1.
Download original image
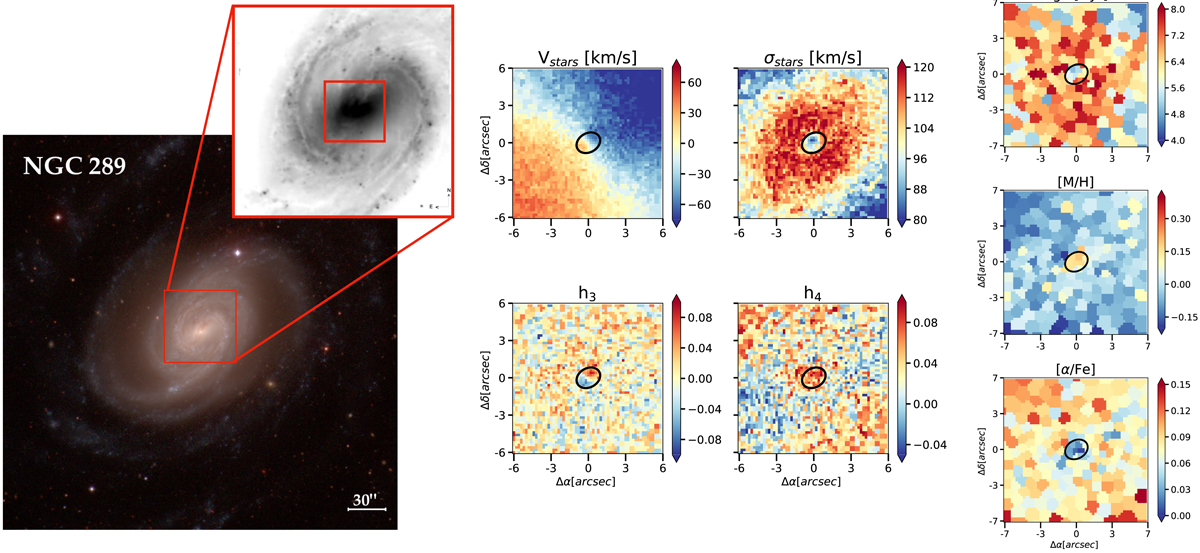
NGC 289 data and derived maps. On the left, we display the colour composites of NGC 289 from the Carnegie-Irvine Galaxy Survey (CGS, Ho et al. 2011) together with the black and white image from MUSE ESO archival data (MAD, Erroz-Ferrer et al. 2019). We highlight the central region from which we derive the kinematic and stellar population maps. On the right, we display the seven spatial maps with derived kinematic and stellar population properties: stellar velocity (Vstars), stellar velocity dispersion (σstars), the Gauss-Hermite higher-order moments, h3 and h4 (Van Der Marel & Franx 1993), mean age, metallicity ([M/H]), and α elements enhancement ([α/Fe]). Together with the spatial maps, we display the limit of the nuclear disc in a black solid ellipse. We find a nuclear disc with a radius size of 90 pc. Within the limits of the ellipse, we can notice all the expected properties of a nuclear disc: increase in stellar velocity, decrease in stellar velocity dispersion, anti-correlation between h3 and the stellar velocity, increase in h4, decrease in mean ages, increase in [M/H], and decrease in [α/Fe].
Current usage metrics show cumulative count of Article Views (full-text article views including HTML views, PDF and ePub downloads, according to the available data) and Abstracts Views on Vision4Press platform.
Data correspond to usage on the plateform after 2015. The current usage metrics is available 48-96 hours after online publication and is updated daily on week days.
Initial download of the metrics may take a while.