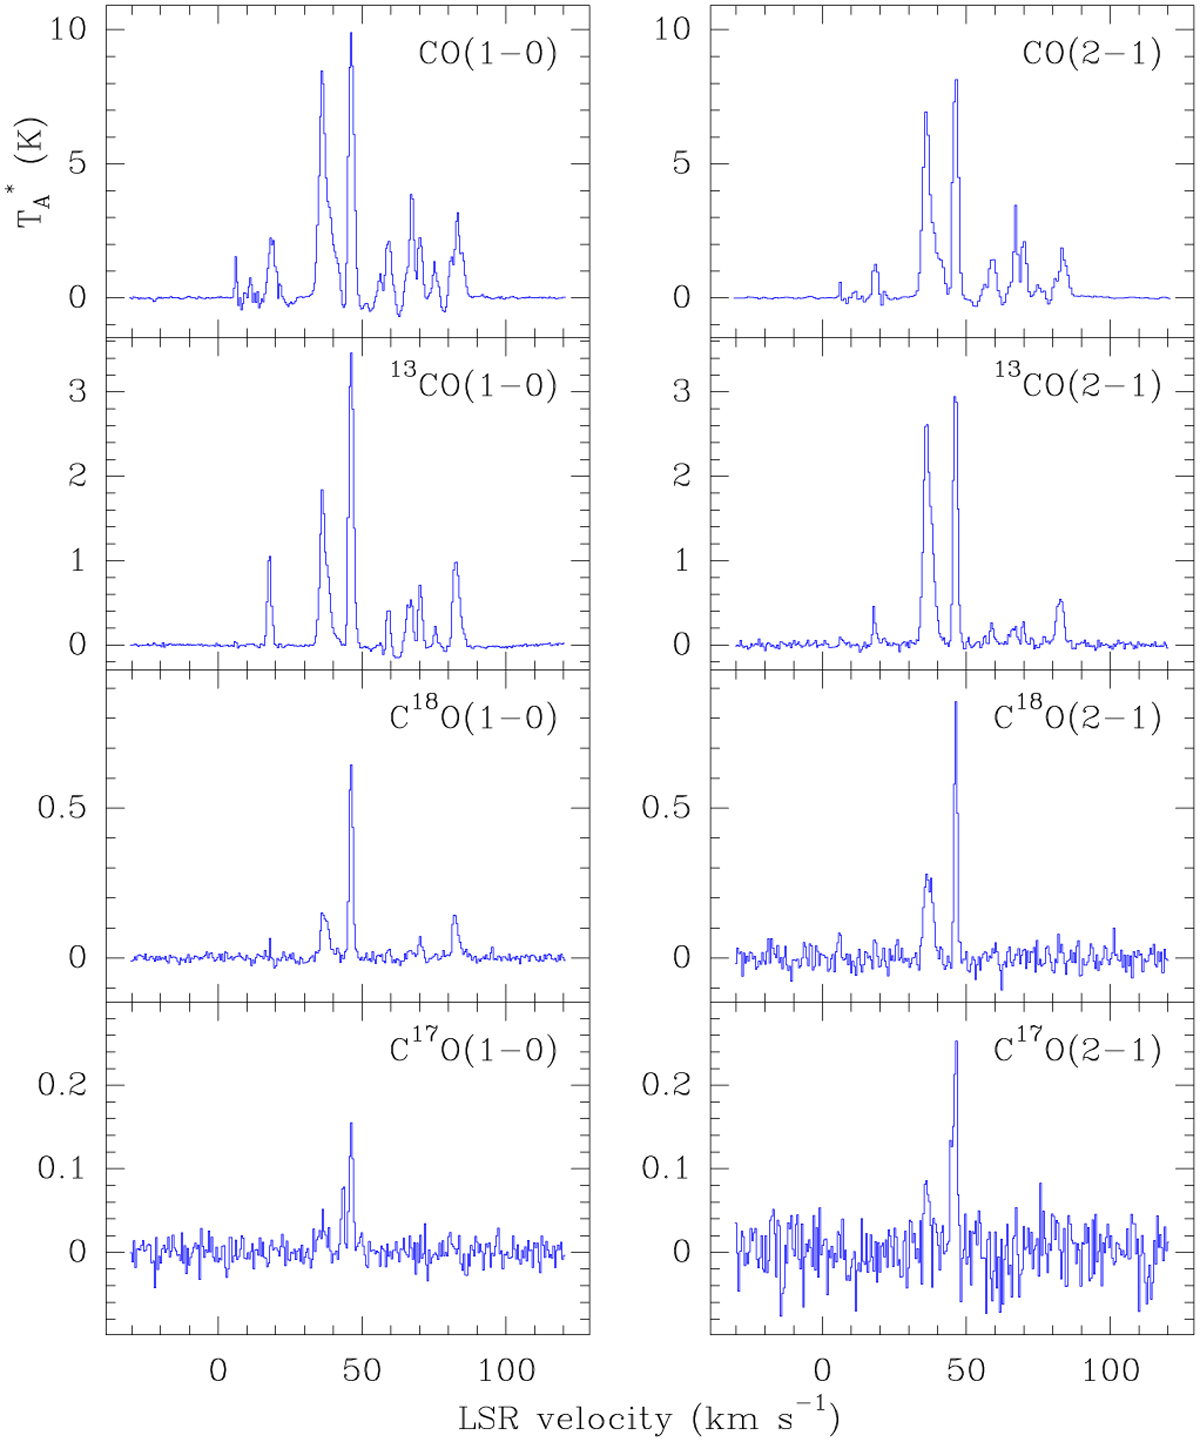
Fig. 1

Download original image
CO and isotopologues in the direction of AFGL 2298. The species and their corresponding rotational lines are indicated in the upper-left corner of each spectrum. All spectra are displayed at the same velocity range. To ease a comparison, the J = 1 → 0 (left column) and the 2 → 1 (right column) lines are plotted on the same intensity scale. The most intense components, roughly at 38 and 46 km s−1 (components A and B, see text) are the only ones present in all the lines. The C17O lines have hyperfine structure, which is noted in the splitting at component B.
Current usage metrics show cumulative count of Article Views (full-text article views including HTML views, PDF and ePub downloads, according to the available data) and Abstracts Views on Vision4Press platform.
Data correspond to usage on the plateform after 2015. The current usage metrics is available 48-96 hours after online publication and is updated daily on week days.
Initial download of the metrics may take a while.


